
From traditional to cryptocurrency markets, MACD has always been and will continue to be one of the imperative indicators used in technical analysis to identify momentum and confirm trends.
This article will discover what makes MACD so informative and test out strategies involving the MACD indicator to help you make timely trades and hopefully walk away with a win. We will answer questions like, what is the MACD indicator, and how to utilize it effectively while trading crypto assets.
Without any further delay, let’s just dive right in.
MACD Indicator Explained
Originating in the 1970s, MACD is one of the simplest and most effective technical indicators used to identify market momentum. Gerald Appel (MACD inventor) is an active trader himself. He has written 17 investment books on this topic, including “Understanding MACD”, a so-called comprehensive guide to the MACD indicator. MACD stands for Moving Average Convergence Divergence and shows the relationship between two moving averages - 12 and 26-period exponential moving averages or EMAs.
More specifically, MACD is a lagging indicator, which means that it doesn’t set a trend - it confirms it. Since the indicator is solely based on historical data, it can’t showcase the future price movements before they actually occur, but that doesn’t mean it is useless for forecasting. Like almost all lagging indicators, MACD comes in handy by giving traders clues and insights about where the price may go next.
How to Read MACD Chart?
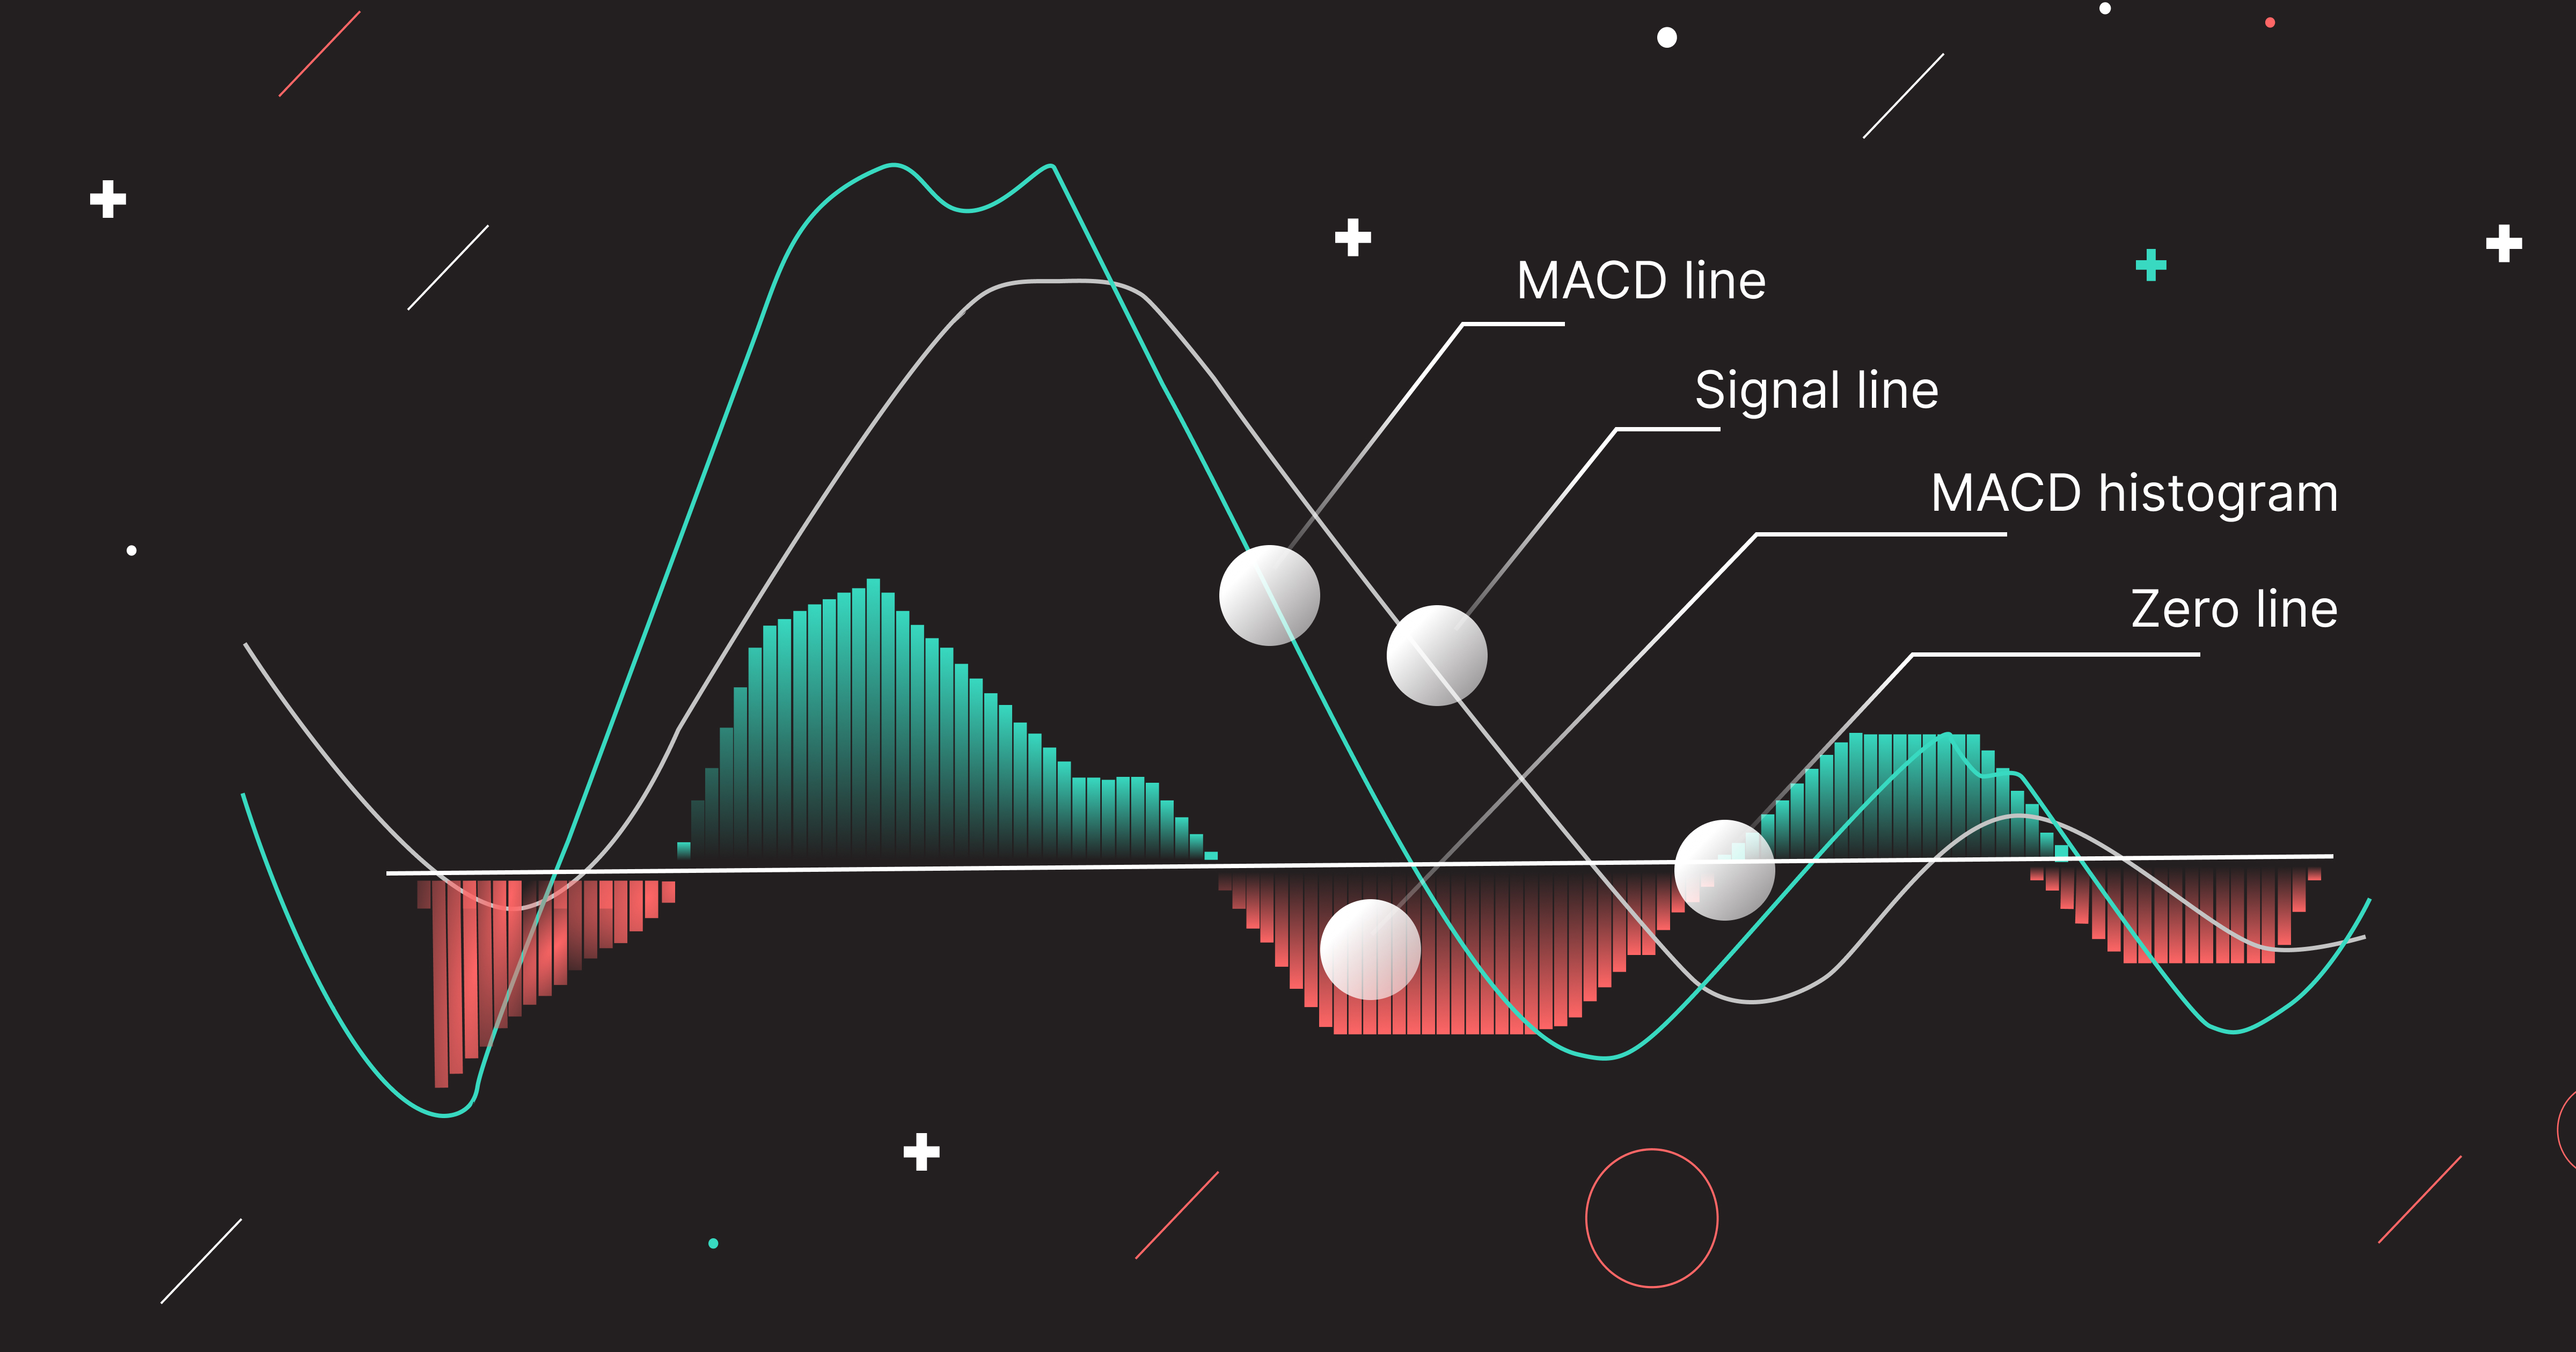
MACD indicator consists of 4 components:
- MACD line, derived by subtracting the 26-period EMA from the 12-period EMA. It moves faster and is more sensitive to price fluctuations. The MACD line indicates upward or downward momentum by measuring the gap between two EMAs.
- Signal line, equals a 9-day exponential moving average and crosses the MACD line, acting as a trigger for buy and sell signals. Compared to the MACD line, the signal line reacts slower and looks smoother.
- MACD histogram. The histogram measures the distance between the MACD and Signal line. The rule on how to read MACD histogram is straightforward: if the MACD line crosses above the Signal line, the histogram turns green (positive bar); otherwise, the histogram turns red (negative bar). The width between the MACD line and the Signal line influences the size of the histogram as well.
- And finally, a MACD zero line represents the “equator” of the MACD histogram.
The MACD indicator, as the name implies, is concerned with the convergence and divergence of two moving averages. The correlation between the two lines can be defined as convergent or divergent, with convergent referring to when the lines move toward one another and divergent referring to when they move apart.
Since MACD showcases the correlation between the 2 moving averages, why should you use it specifically and not 2 moving averages simultaneously? People say a picture's worth a thousand words - let’s look at the DOGE/USDT chart then.
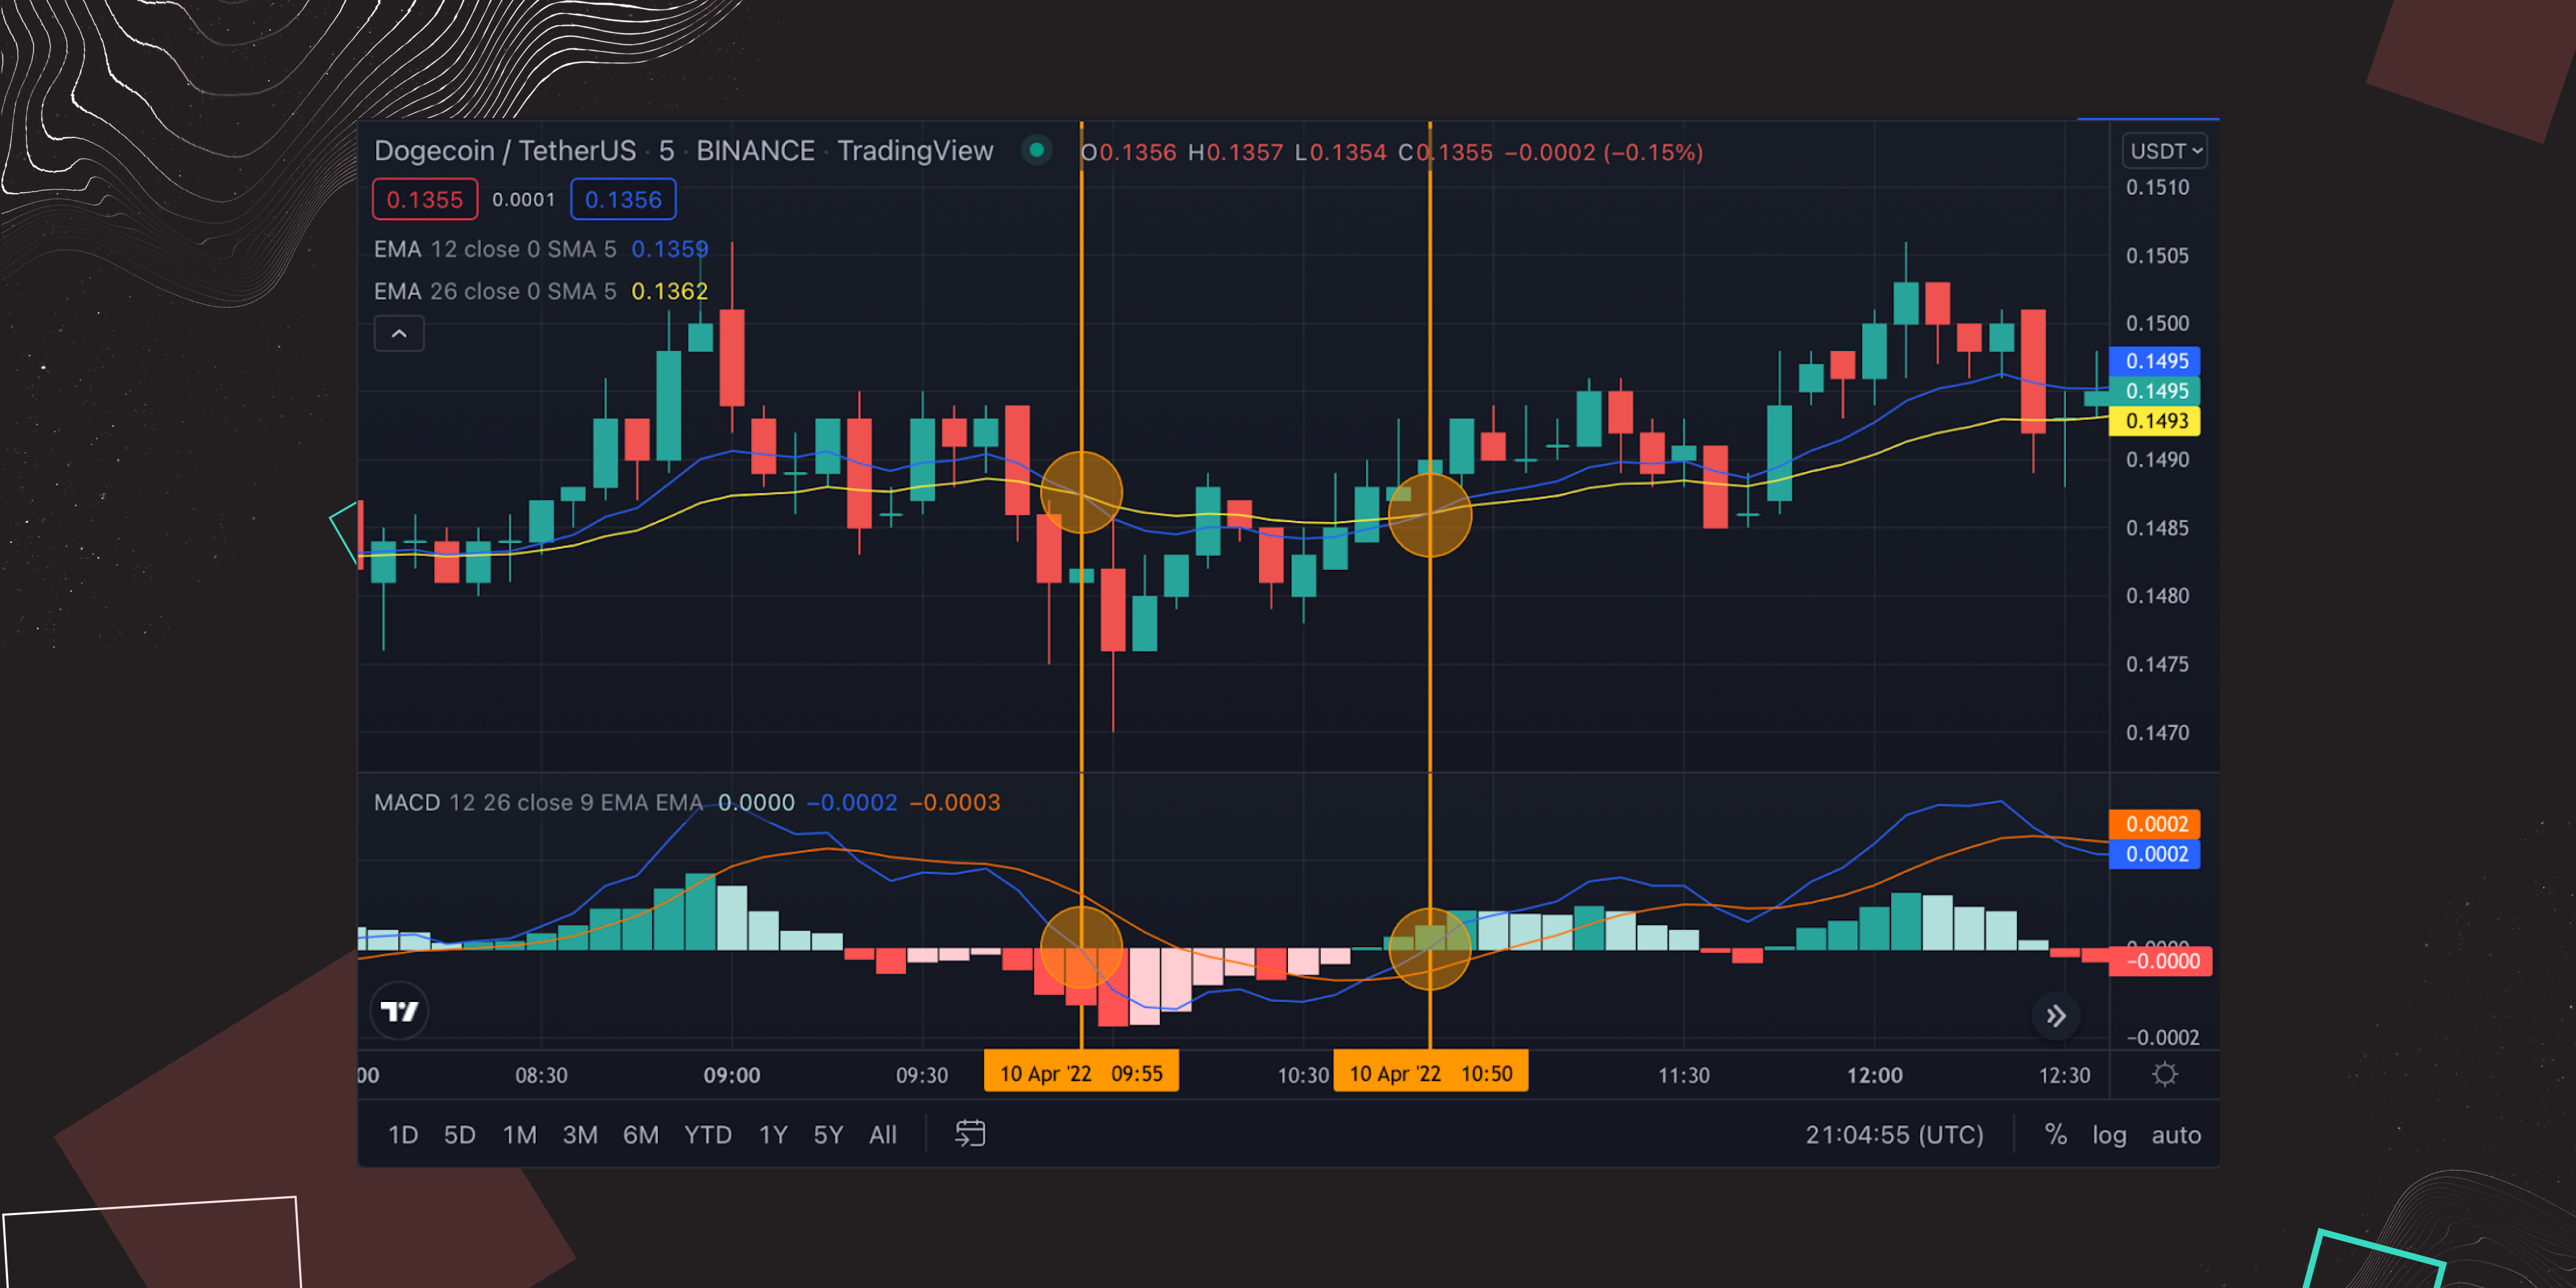
Two exponential moving averages in the chart above are set to default settings (12 and 26 EMA), and so is the MACD line on the chart below. Every time we have a crossover on the moving averages, we also have a crossover on the MACD, but it's only between the MACD line and the zero line. So, you should not trust the crossover between MACD and zero line, because it gives late signals, compared to MACD and Signal line crossover. Let’s look at the example below.
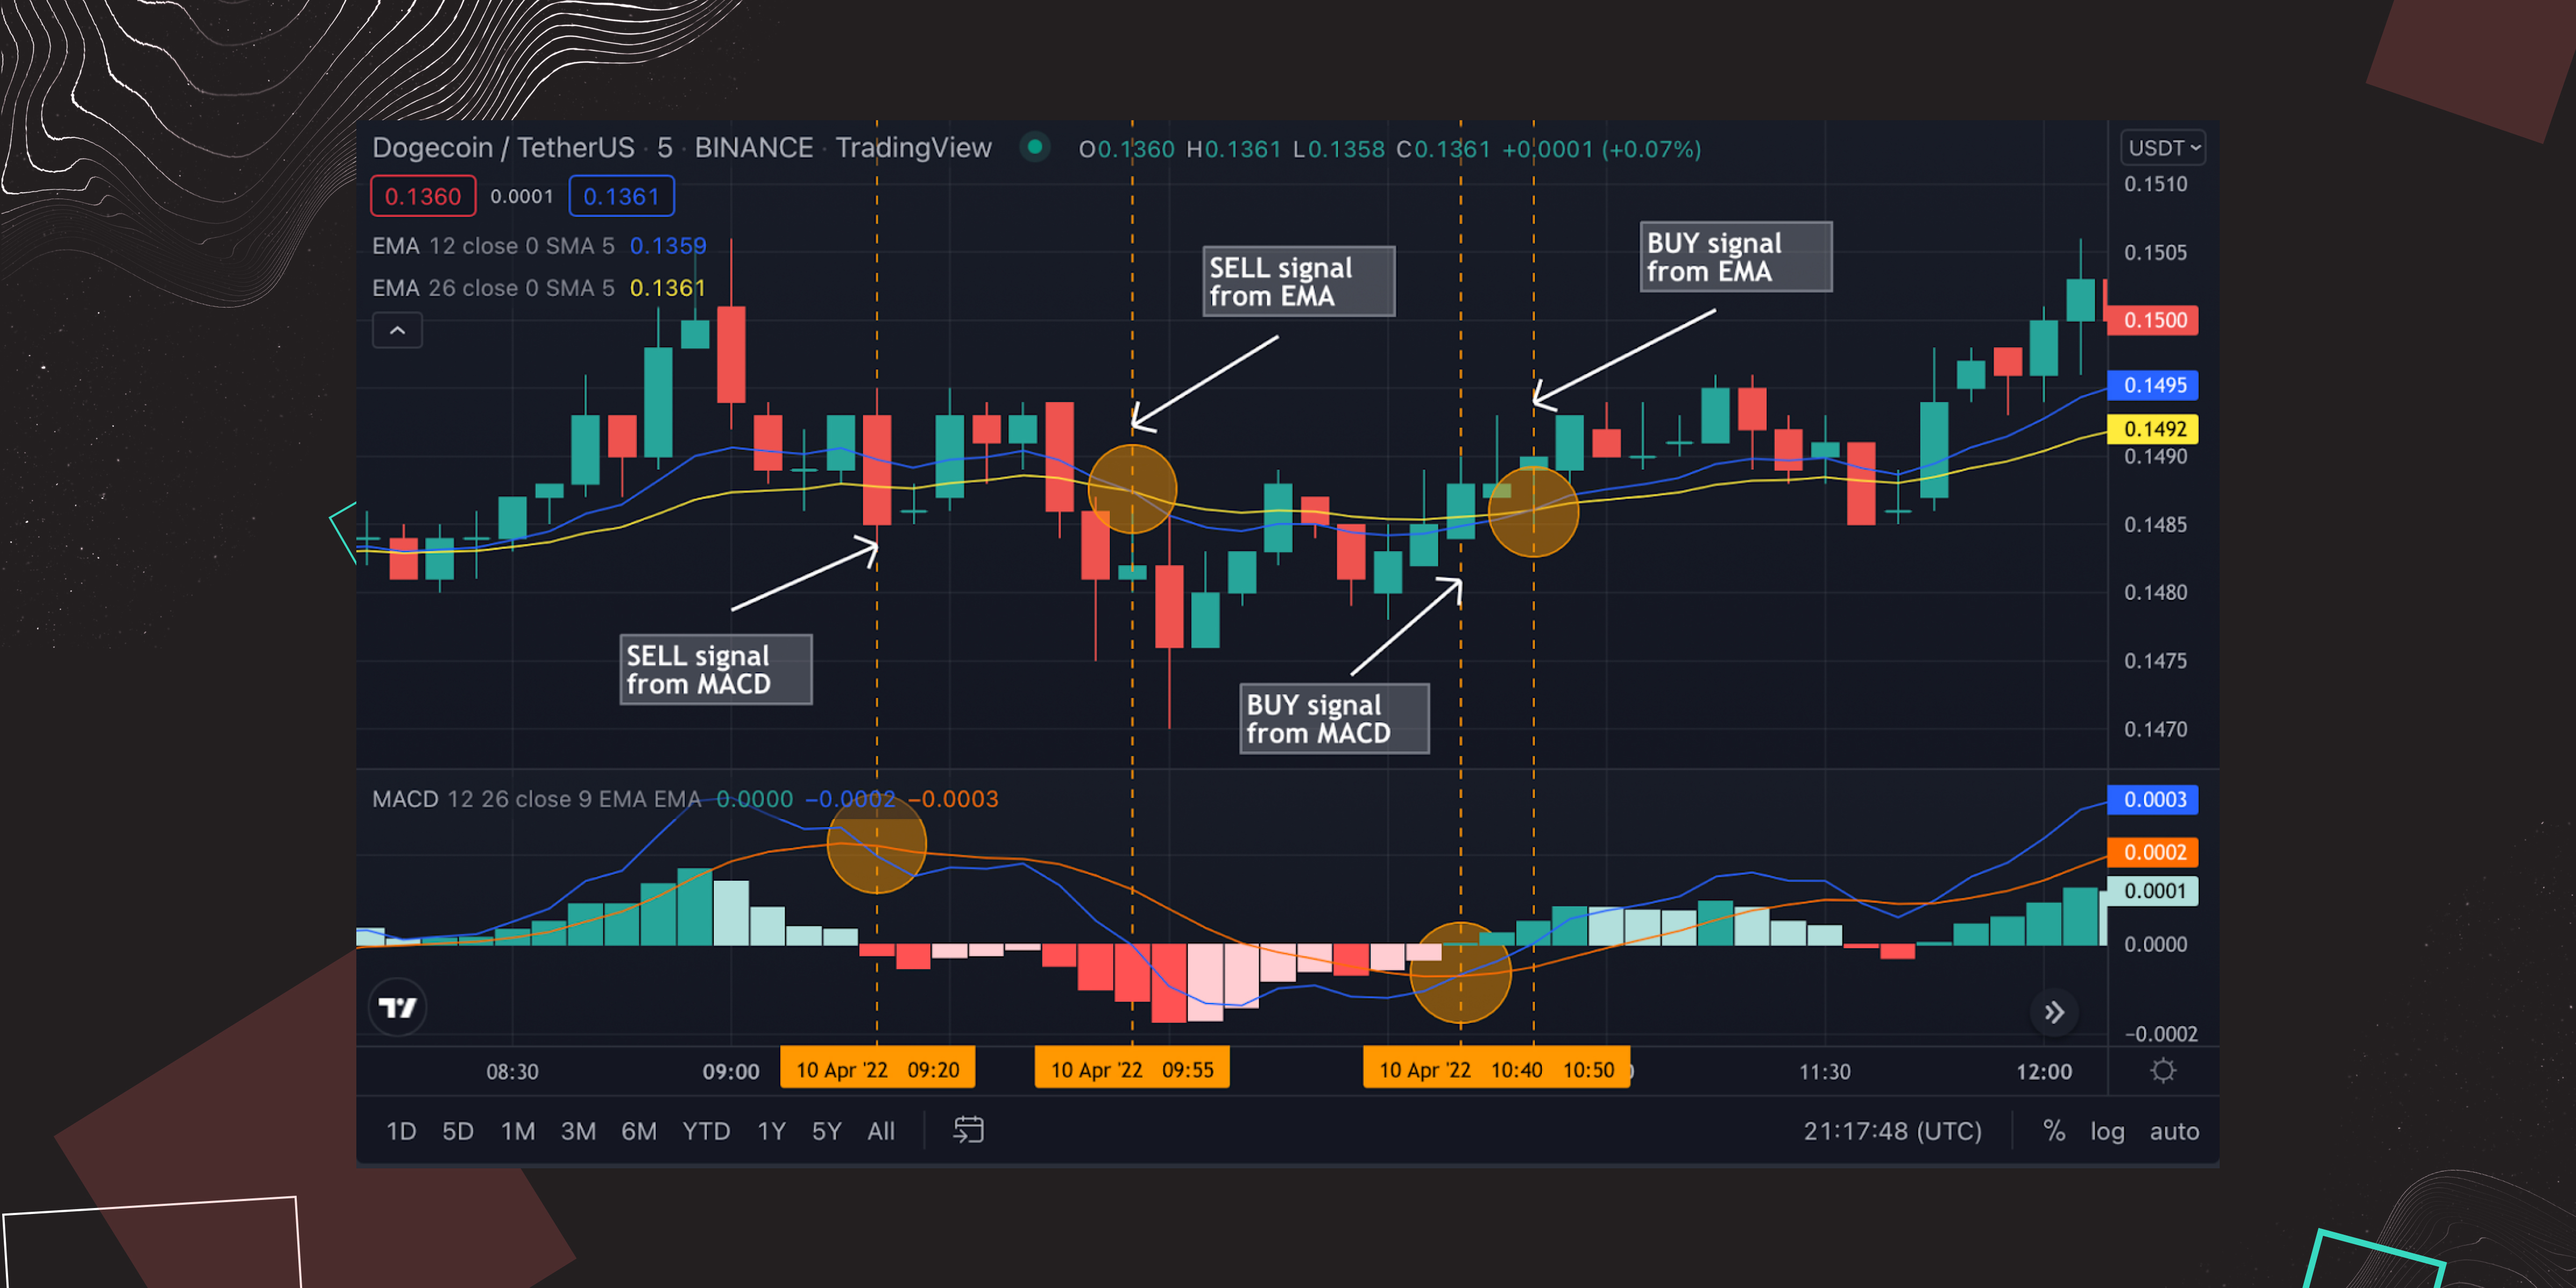
Note, what we look for in the MACD is not the zero line but rather the crossover between the MACD line and the signal line. You can clearly observe that the crossover on the MACD gave a much earlier entry signal than the crossover on the moving average, thereby predicting a trend change in advance. It enables a trader to enter or exit positions earlier that positively affect the overall P&L.
MACD Formula
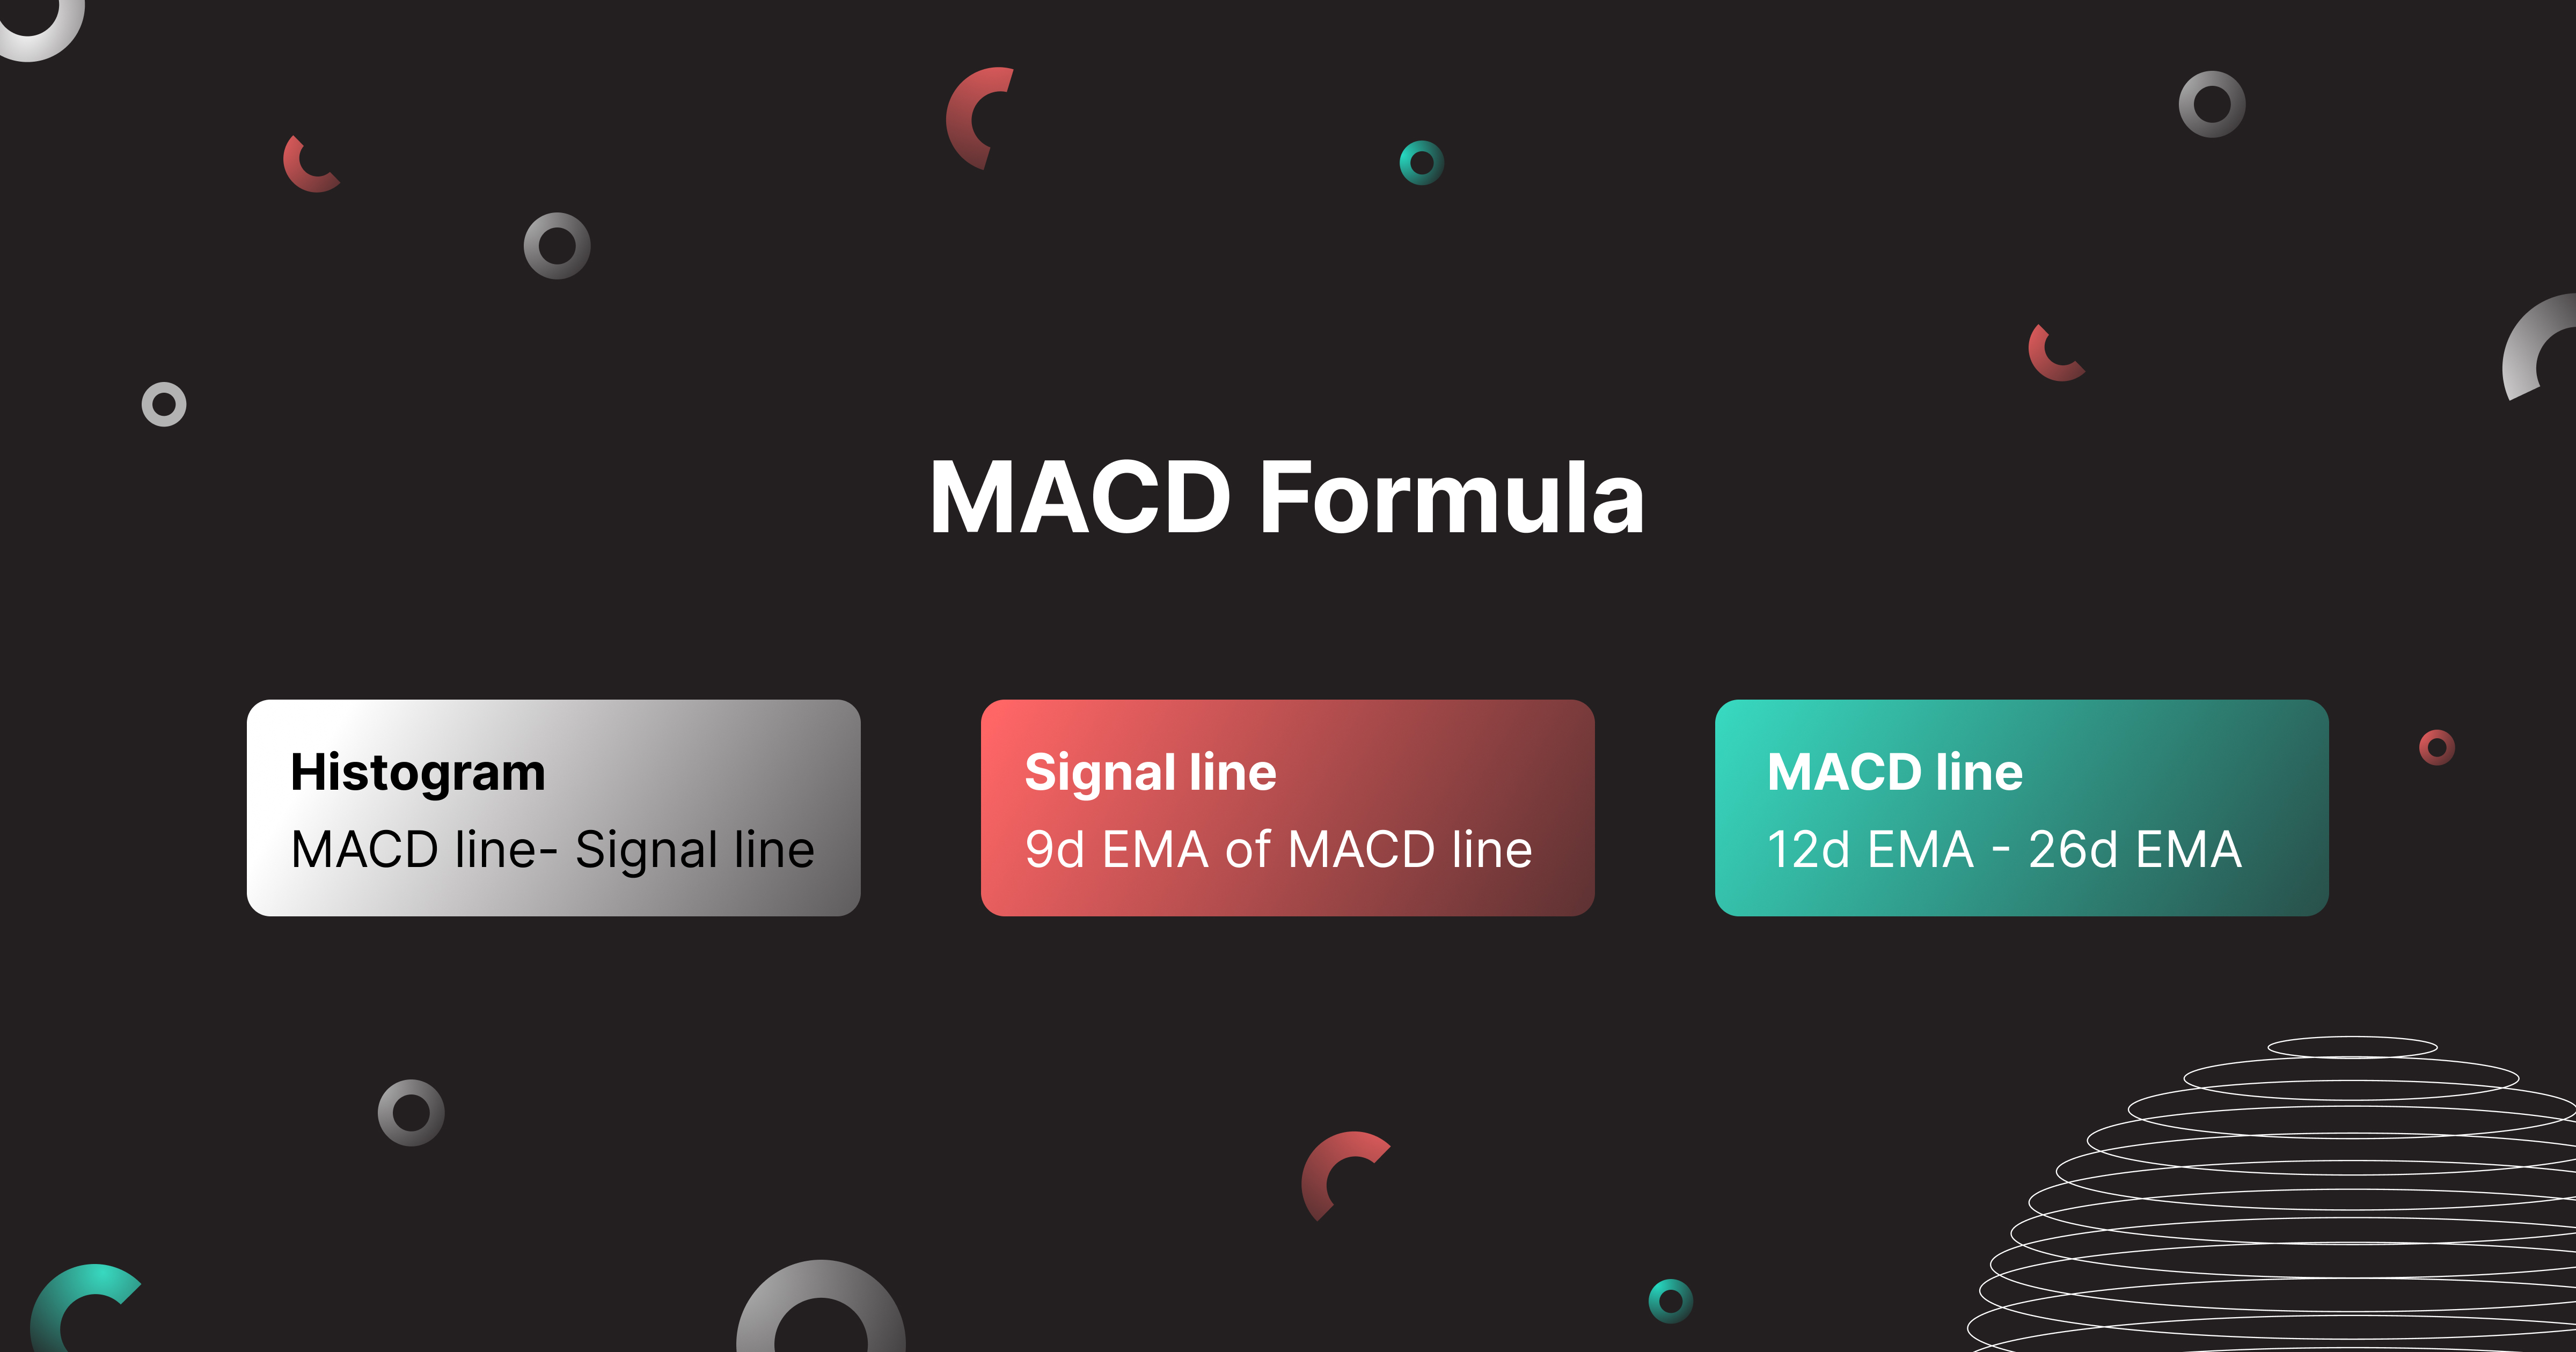
- MACD Line: 12-day EMA - 26-day EMA.
- MACD Signal Line: 9-day EMA of MACD Line.
- MACD Histogram: MACD Line - Signal Line.
The standard MACD settings are 12, 26, and 9. The same settings are used in crypto trading. However, different values can be used according to one’s trading style and goals. You can discover the best MACD settings that match your trading objectives and are the most profitable for your timeframe and asset dynamics through trial and error. Though, we don’t recommend newbies to play with the customization.
MACD Strategy: How to Trade Crypto Using MACD Indicator
Now that we’ve learned the basics of the MACD indicator it is high time we knew how to use MACD effectively in your trading strategy. In the next sections, we will break down the 3 most beloved MACD trading strategies that generate strong signals - signal line & MACD crossover, MACD divergence, and MACD/RSI overlap.
Trading Strategy #1 MACD Divergence: How to Spot the Pattern?
A divergence in trading occurs when the price of the underlying asset and indicator moves in the opposite direction. A divergence is not exclusive to the MACD indicator; it also appears for RSI and other oscillators. However, among all the signals or patterns that MACD makes, a MACD divergence is one of the most reliable.
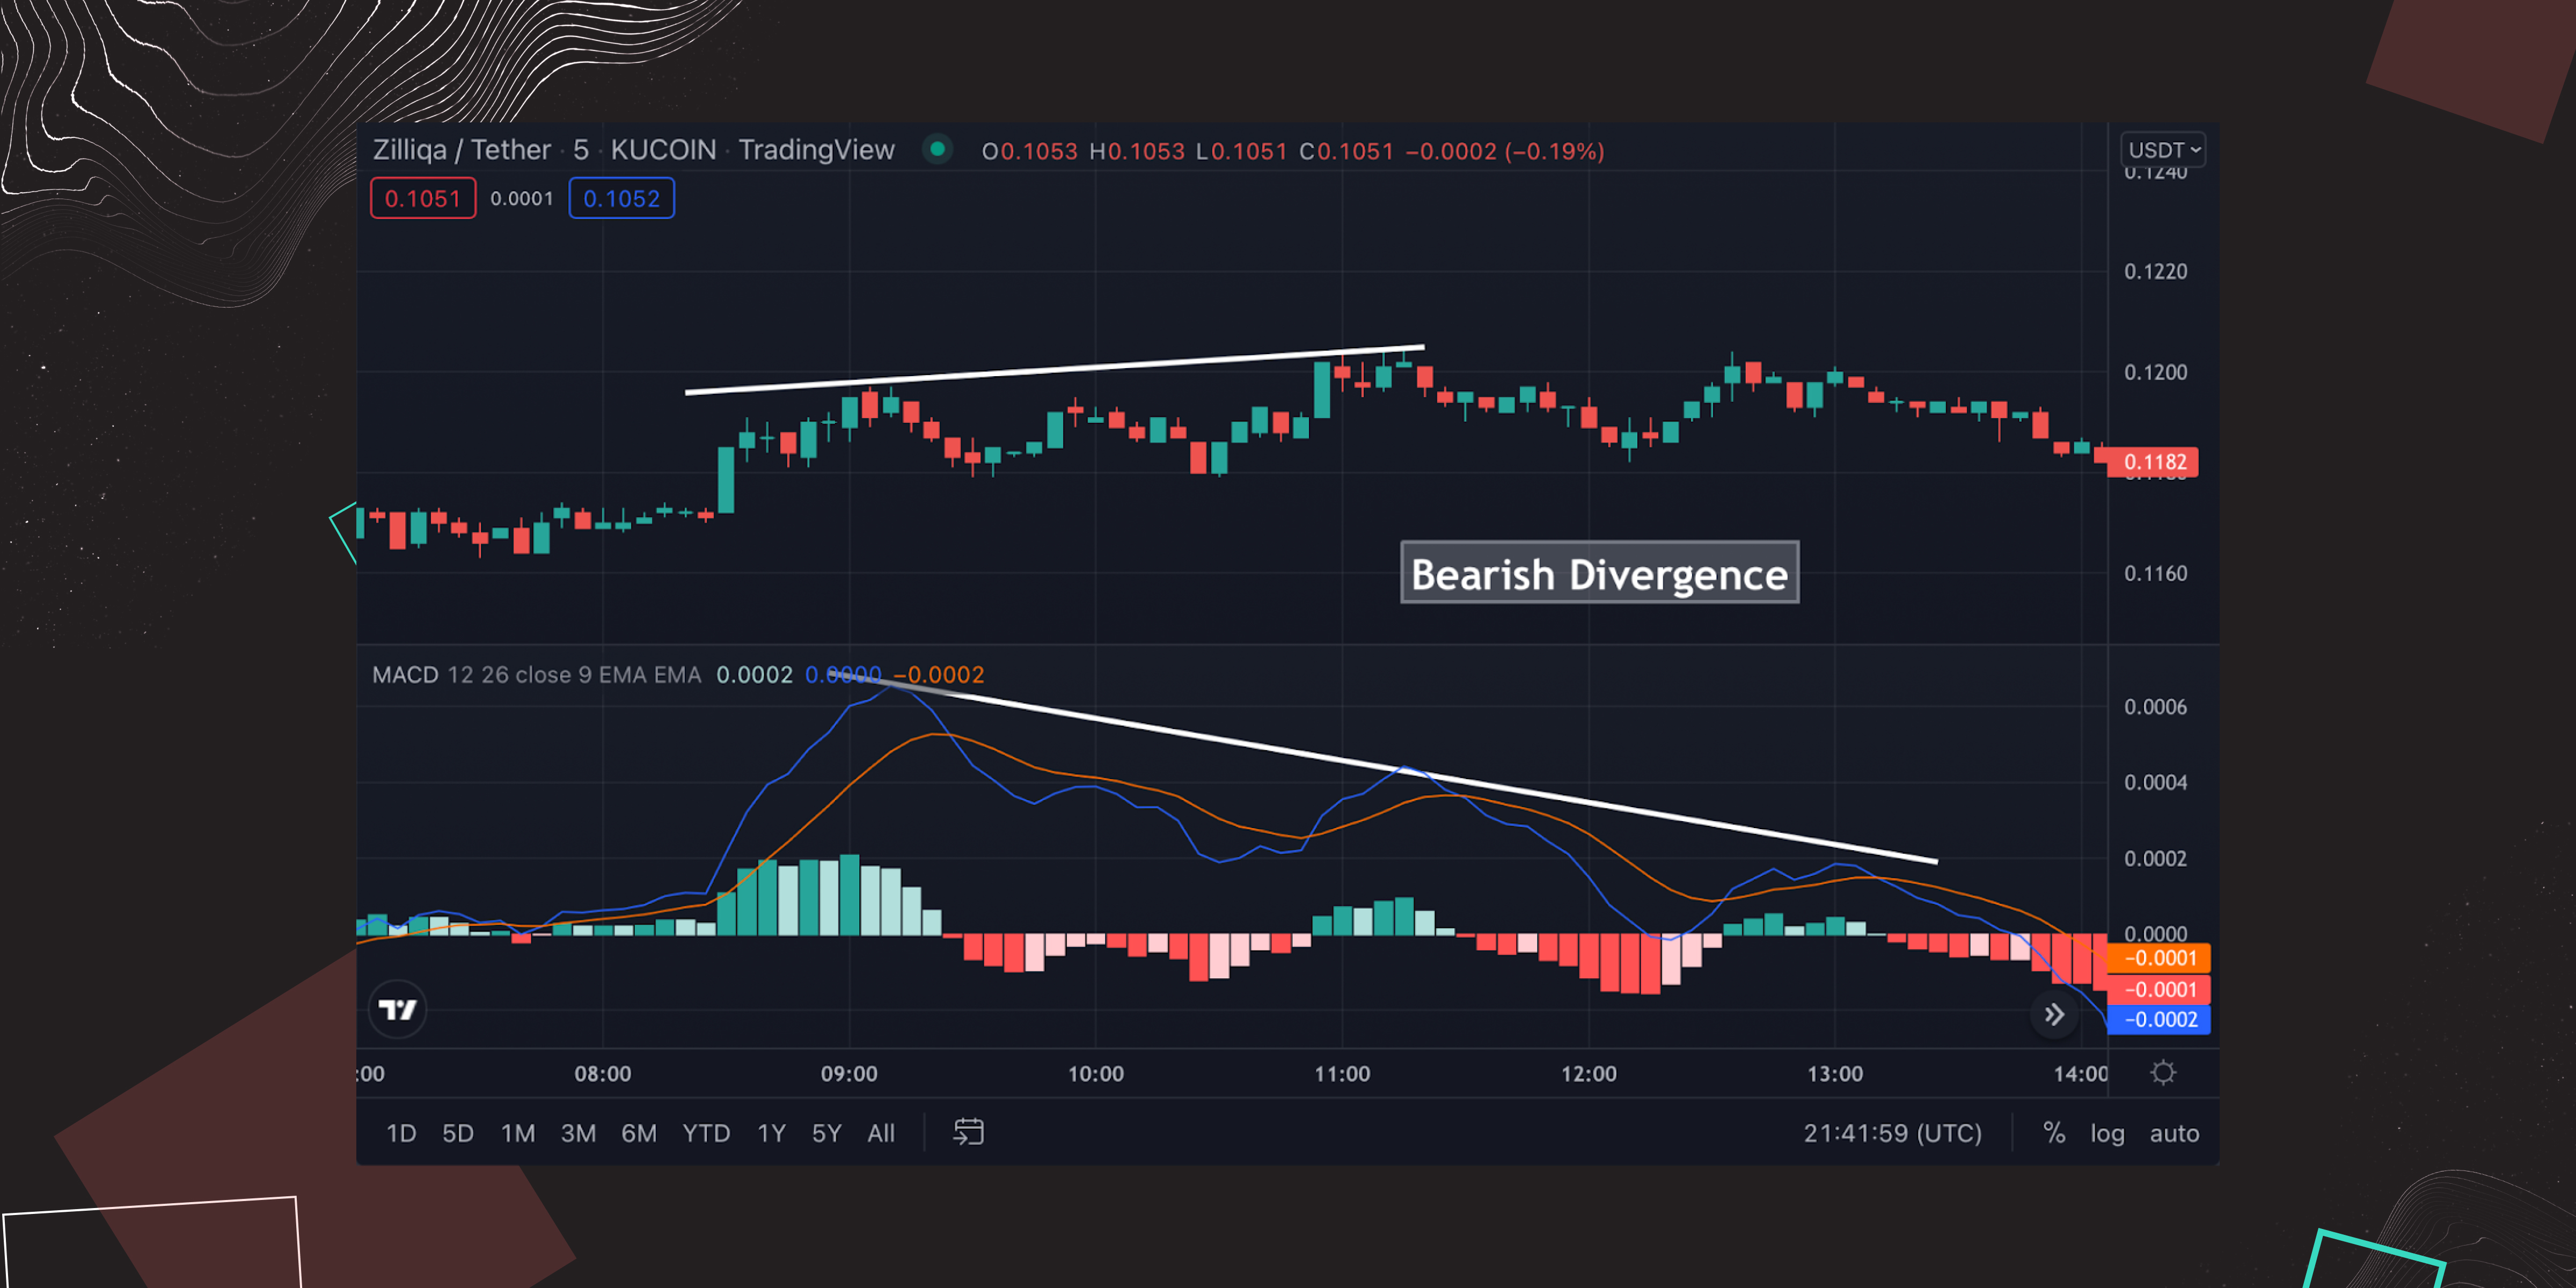
A bearish divergence MACD pattern appears when the MACD forms a lower high corresponding to a higher high in the asset's price. Then, a pullback or trend reversal is more likely because the price is rising while momentum is falling. As a result, we see that the ZIL/USD price dropped by 8% within 3 hours after the signal. So, the MACD bearish divergence perfectly predicted the trend reversal.
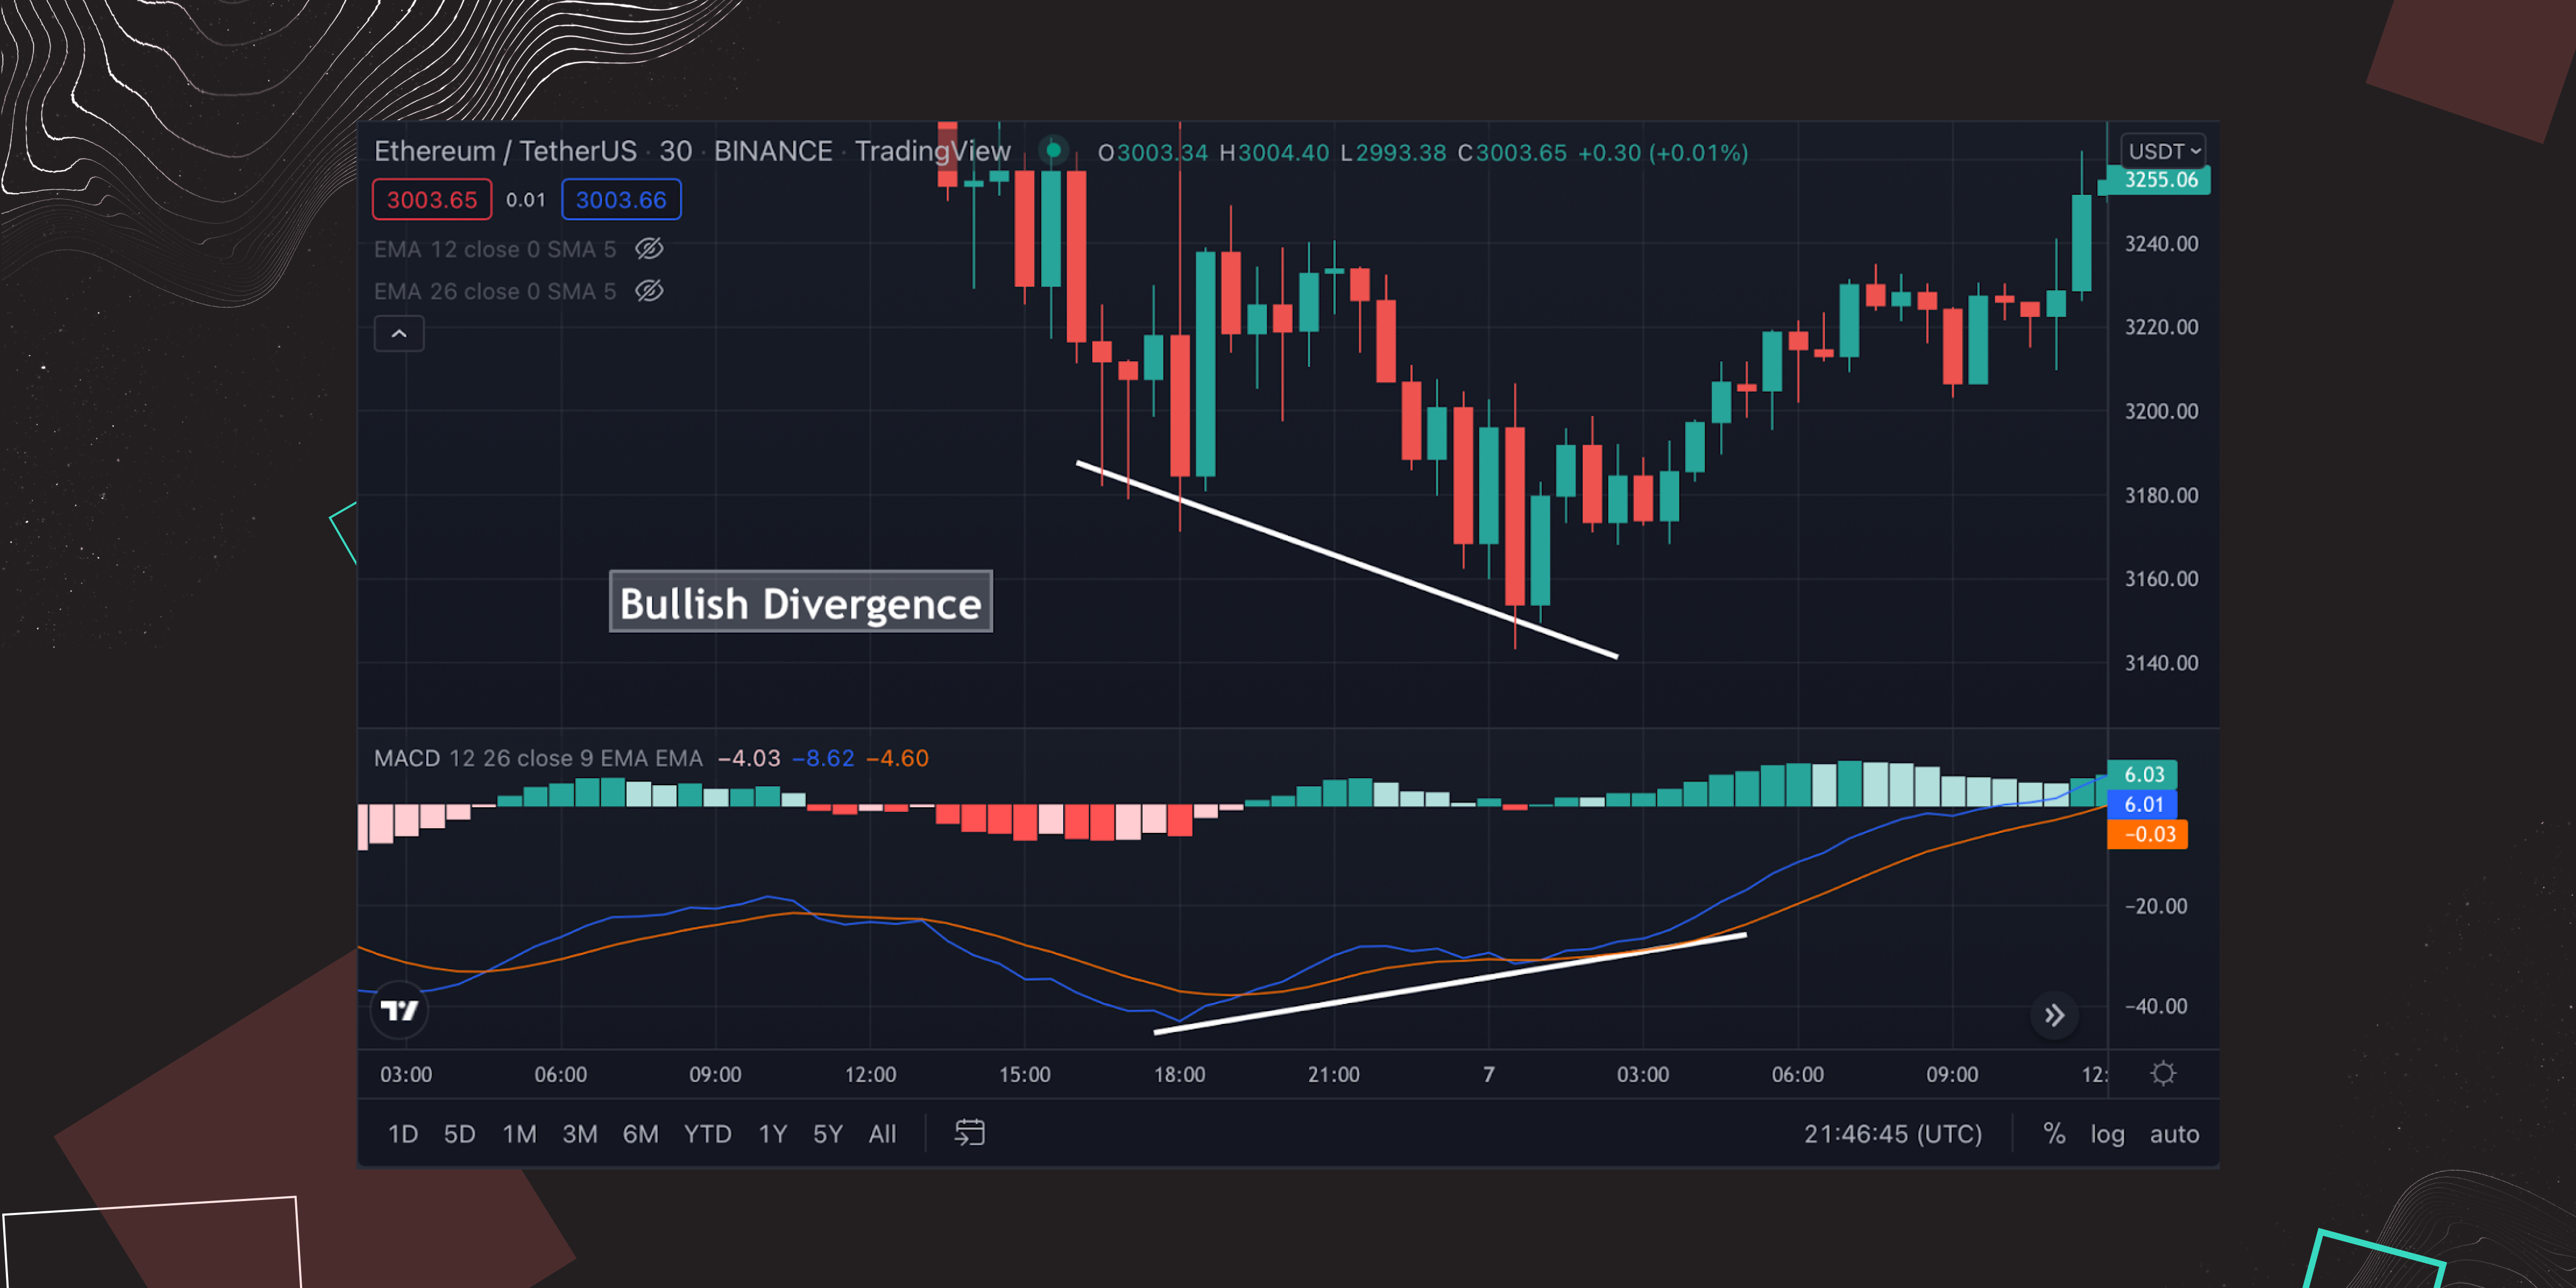
In the picture above, it’s evident that a MACD bullish divergence pattern occurs when the MACD forms a higher low that corresponds with a lower low of the asset’s price. It is a signal that detects a possible reversal. We can clearly observe that the ETH/USDT price rose by 3.3% within 12 hours after the signal. The MACD bullish divergence signal predicted the trend reversal.
Trading Strategy #2: MACD Crossover
MACD crossover strategy is used when the MACD line crosses above or below the signal line or zero line.
Signal Line Crossover
The MACD falling below the signal line is considered a bearish crossover and serves as a “green flag” to sell. Conversely, the MACD rising above the signal line gives a bullish crossover, suggesting the asset’s price experiences upward momentum.
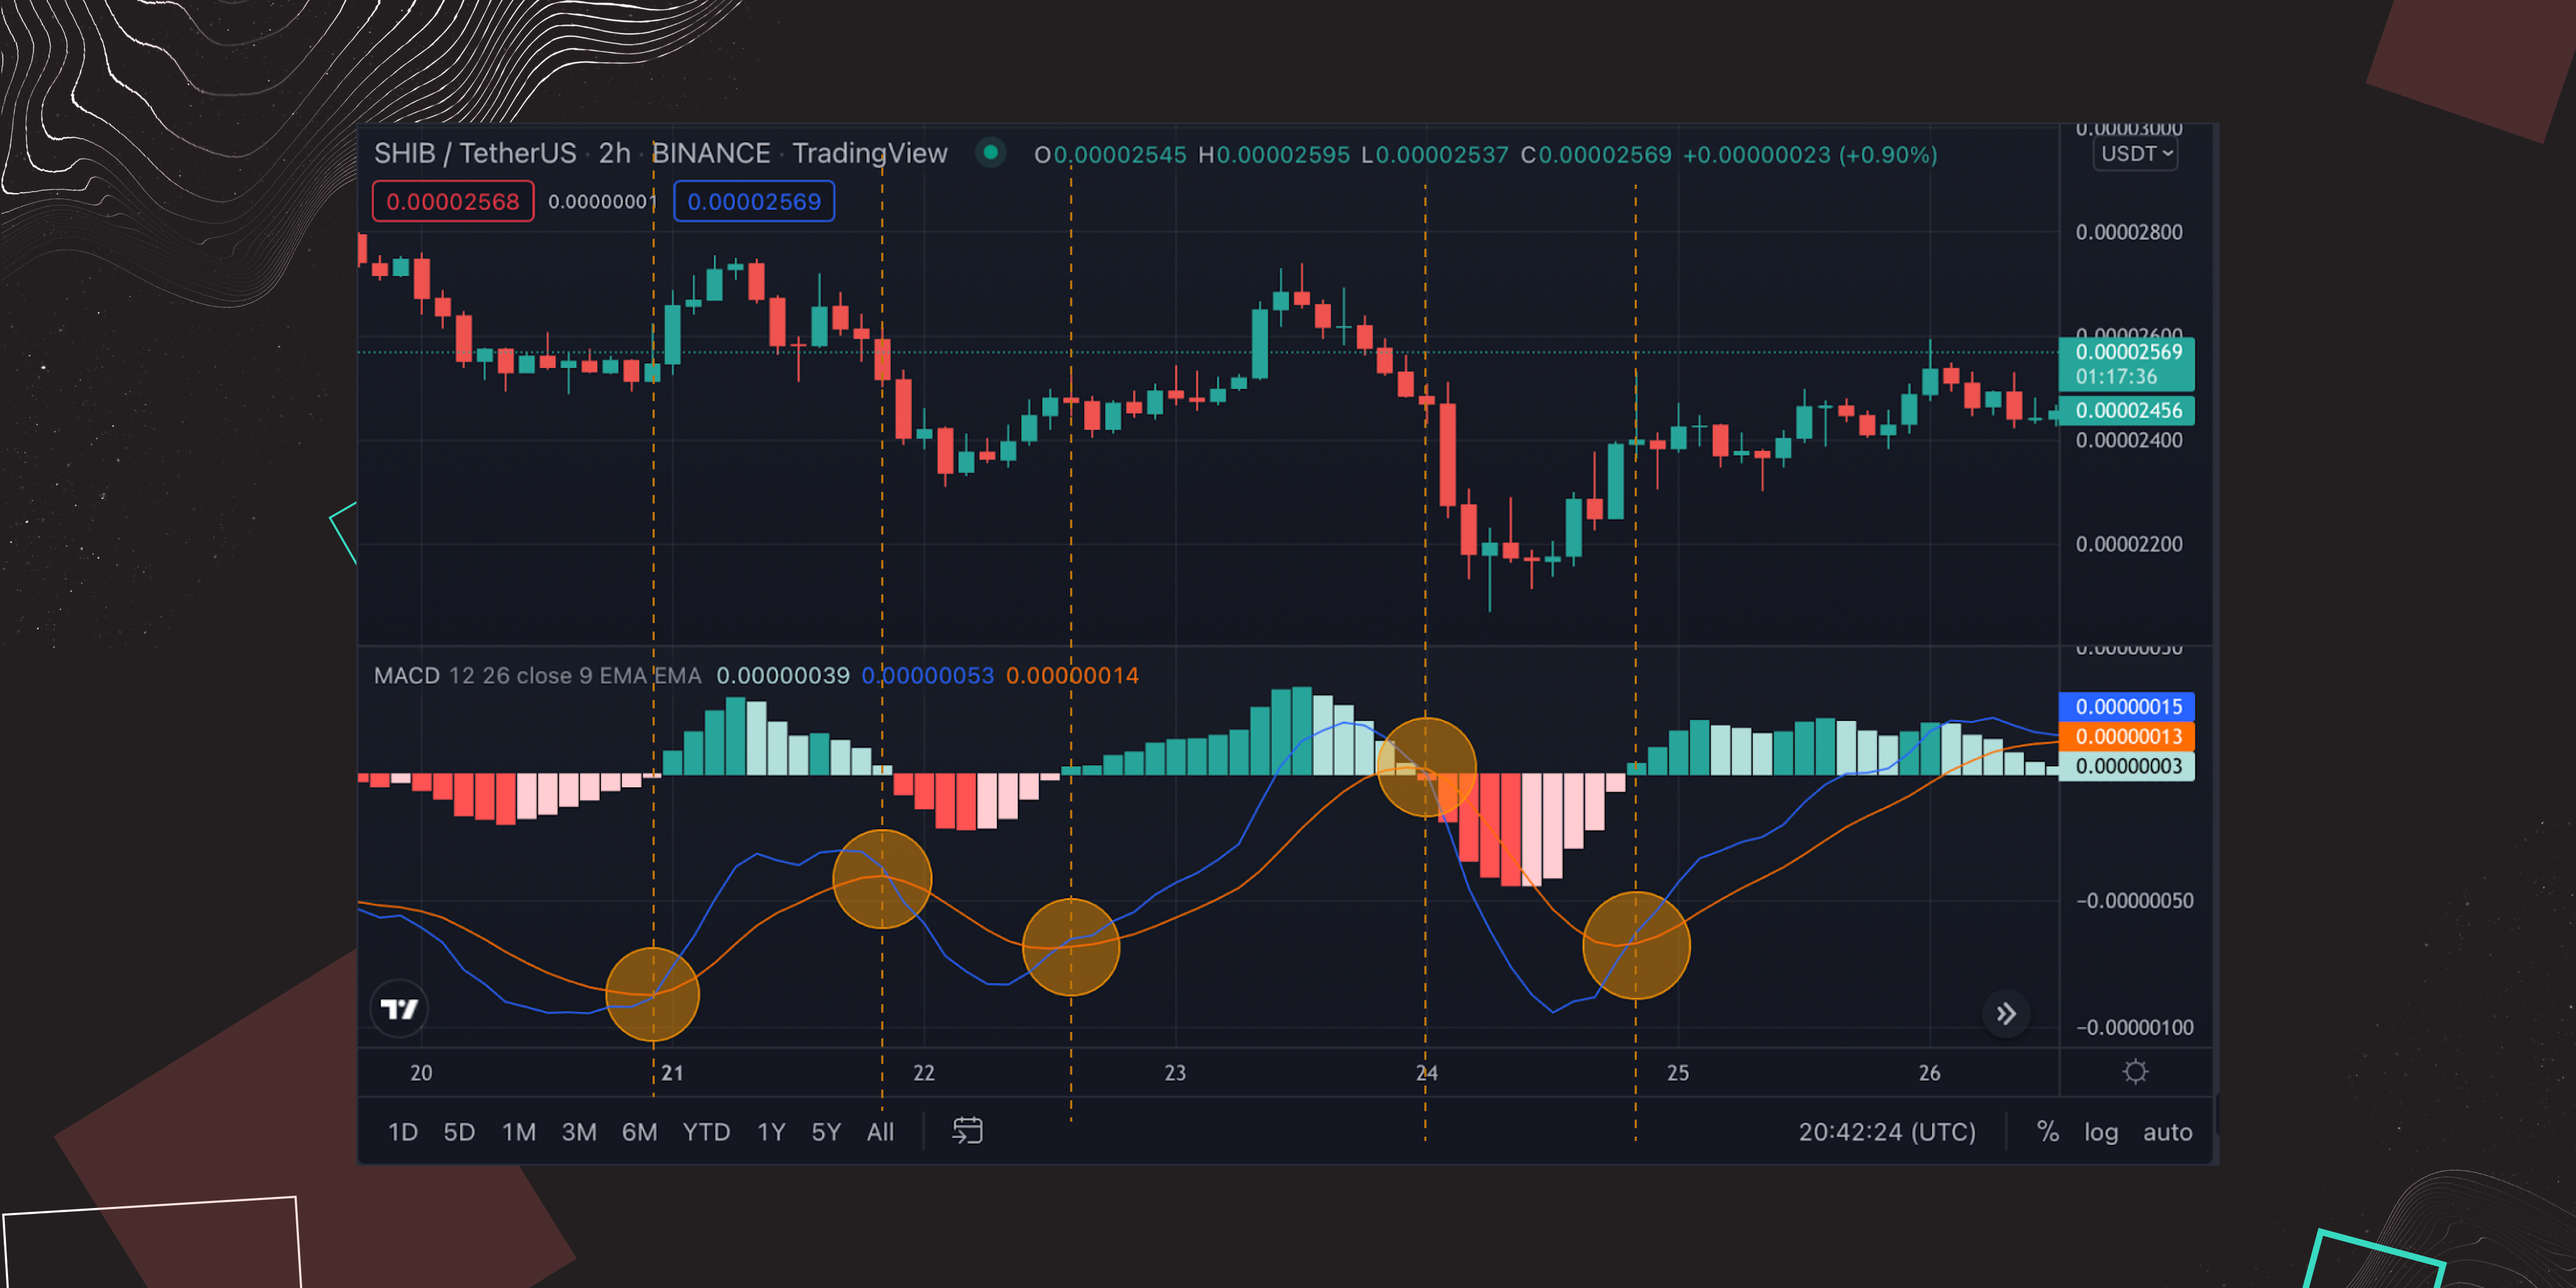
As shown in the SHIB/USDT chart above, 5 signal line crossovers worked well: 3 bullish signals and 2 bearish ones.
Zero Line Crossover
Zero line crossovers are as common as signal line ones. They are easy to understand and do not require trading background information to be used properly.
A positive MACD value occurs when the MACD line crosses above a zero line, implying a stronger upward momentum. A MACD bullish crossover means that the 12-day EMA (blue line) is trading greater than the 26-day (red line). Conversely, a negative MACD occurs when the MACD line crosses below a zero line, implying a stronger downward momentum. A bearish zero line crossover means that the 12-day EMA is trading lower than the 26-day.
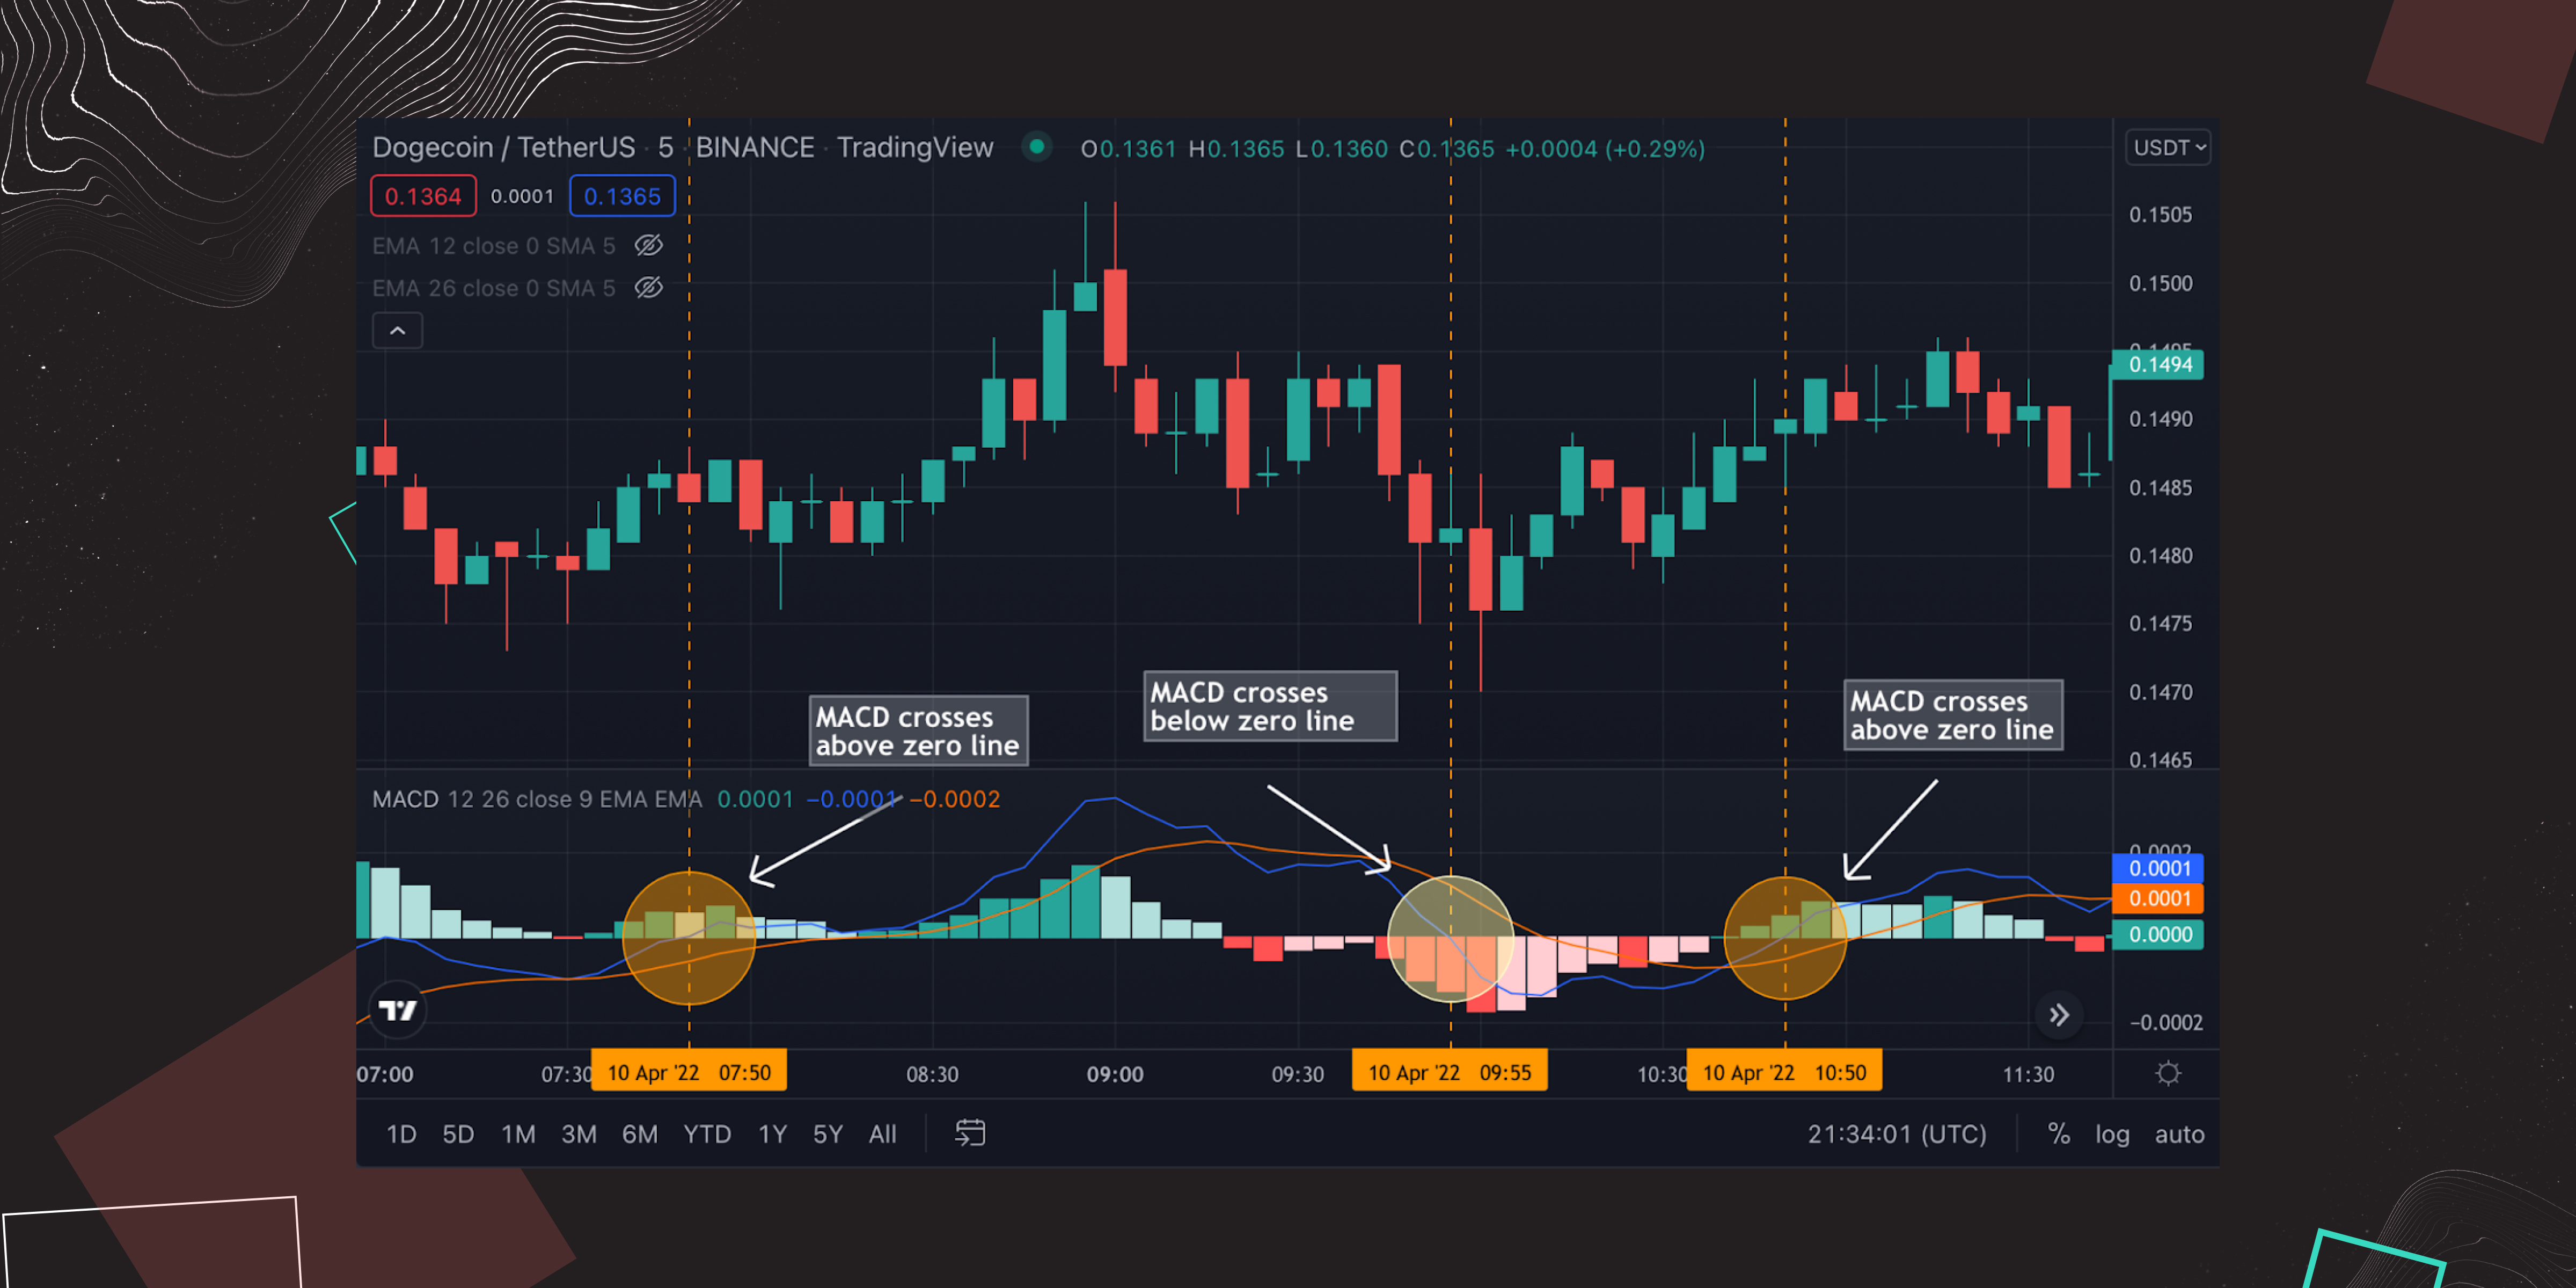
In this particular example of the DODGE/USDT trading pair, the MACD crosses the zero line 3 times, giving traders 1 opportunity to enter a short position and 2 chances to enter long positions.
Traders can also utilize the size of the histogram to determine the strength of the momentum itself. For example, if the MACD crosses above the signal/zero line while the histogram is getting larger, it shows us that the upwards momentum is getting stronger. Similarly, if the histogram is getting smaller in size, it indicates that the upwards momentum is getting weaker.
Note that both zero line and signal line crossovers may happen multiple times producing many false and tricky signals, especially regarding volatile assets such as cryptocurrencies, especially highly volatile tokens like SHIB and DODGE. MACD comes into play as a useful tool for identifying market trades and momentum. However, it is not always accurate and may provide false and misleading signals, especially during weak trending or sideways price action. What we are trying to say is that you should not rely on the MACD indicator alone - it would be better to utilize it along with other indicators, like RSI, for instance, to reduce the risk of mistakes.
Trading Strategy #3: MACD And RSI Strategy
RSI and MACD are two momentum oscillators, widely used by both professional and amateur traders to identify and confirm an asset’s price momentum. Incorporating RSI into your MACD trading strategy as a momentum gauge may provide a lot of accuracy and clarity to your trades.
We already know how MACD works; let’s briefly cover the essentials of the RSI indicator. To give you an idea, RSI is a momentum indicator used to evaluate the overbought and oversold conditions of the market. Our team has also comprehensively reviewed the RSI indicator and its application to crypto trading strategies. If you are eager to learn more, check out our article on the RSI.
One example of a simple MACD/RSI strategy is combining these two indicators to confirm price momentum. If the MACD signals price momentum in a certain direction, you can add RSI to the chart and see if it aligns. If both indicators give similar signals, you can be more sure about going long or short.
You may wonder, how to read MACD and RSI simultaneously? It is not that difficult. We will use RSI to signal potential entry positions and MACD to confirm the patterns.
The LUNA/USDT chart below illustrates this strategy in action:
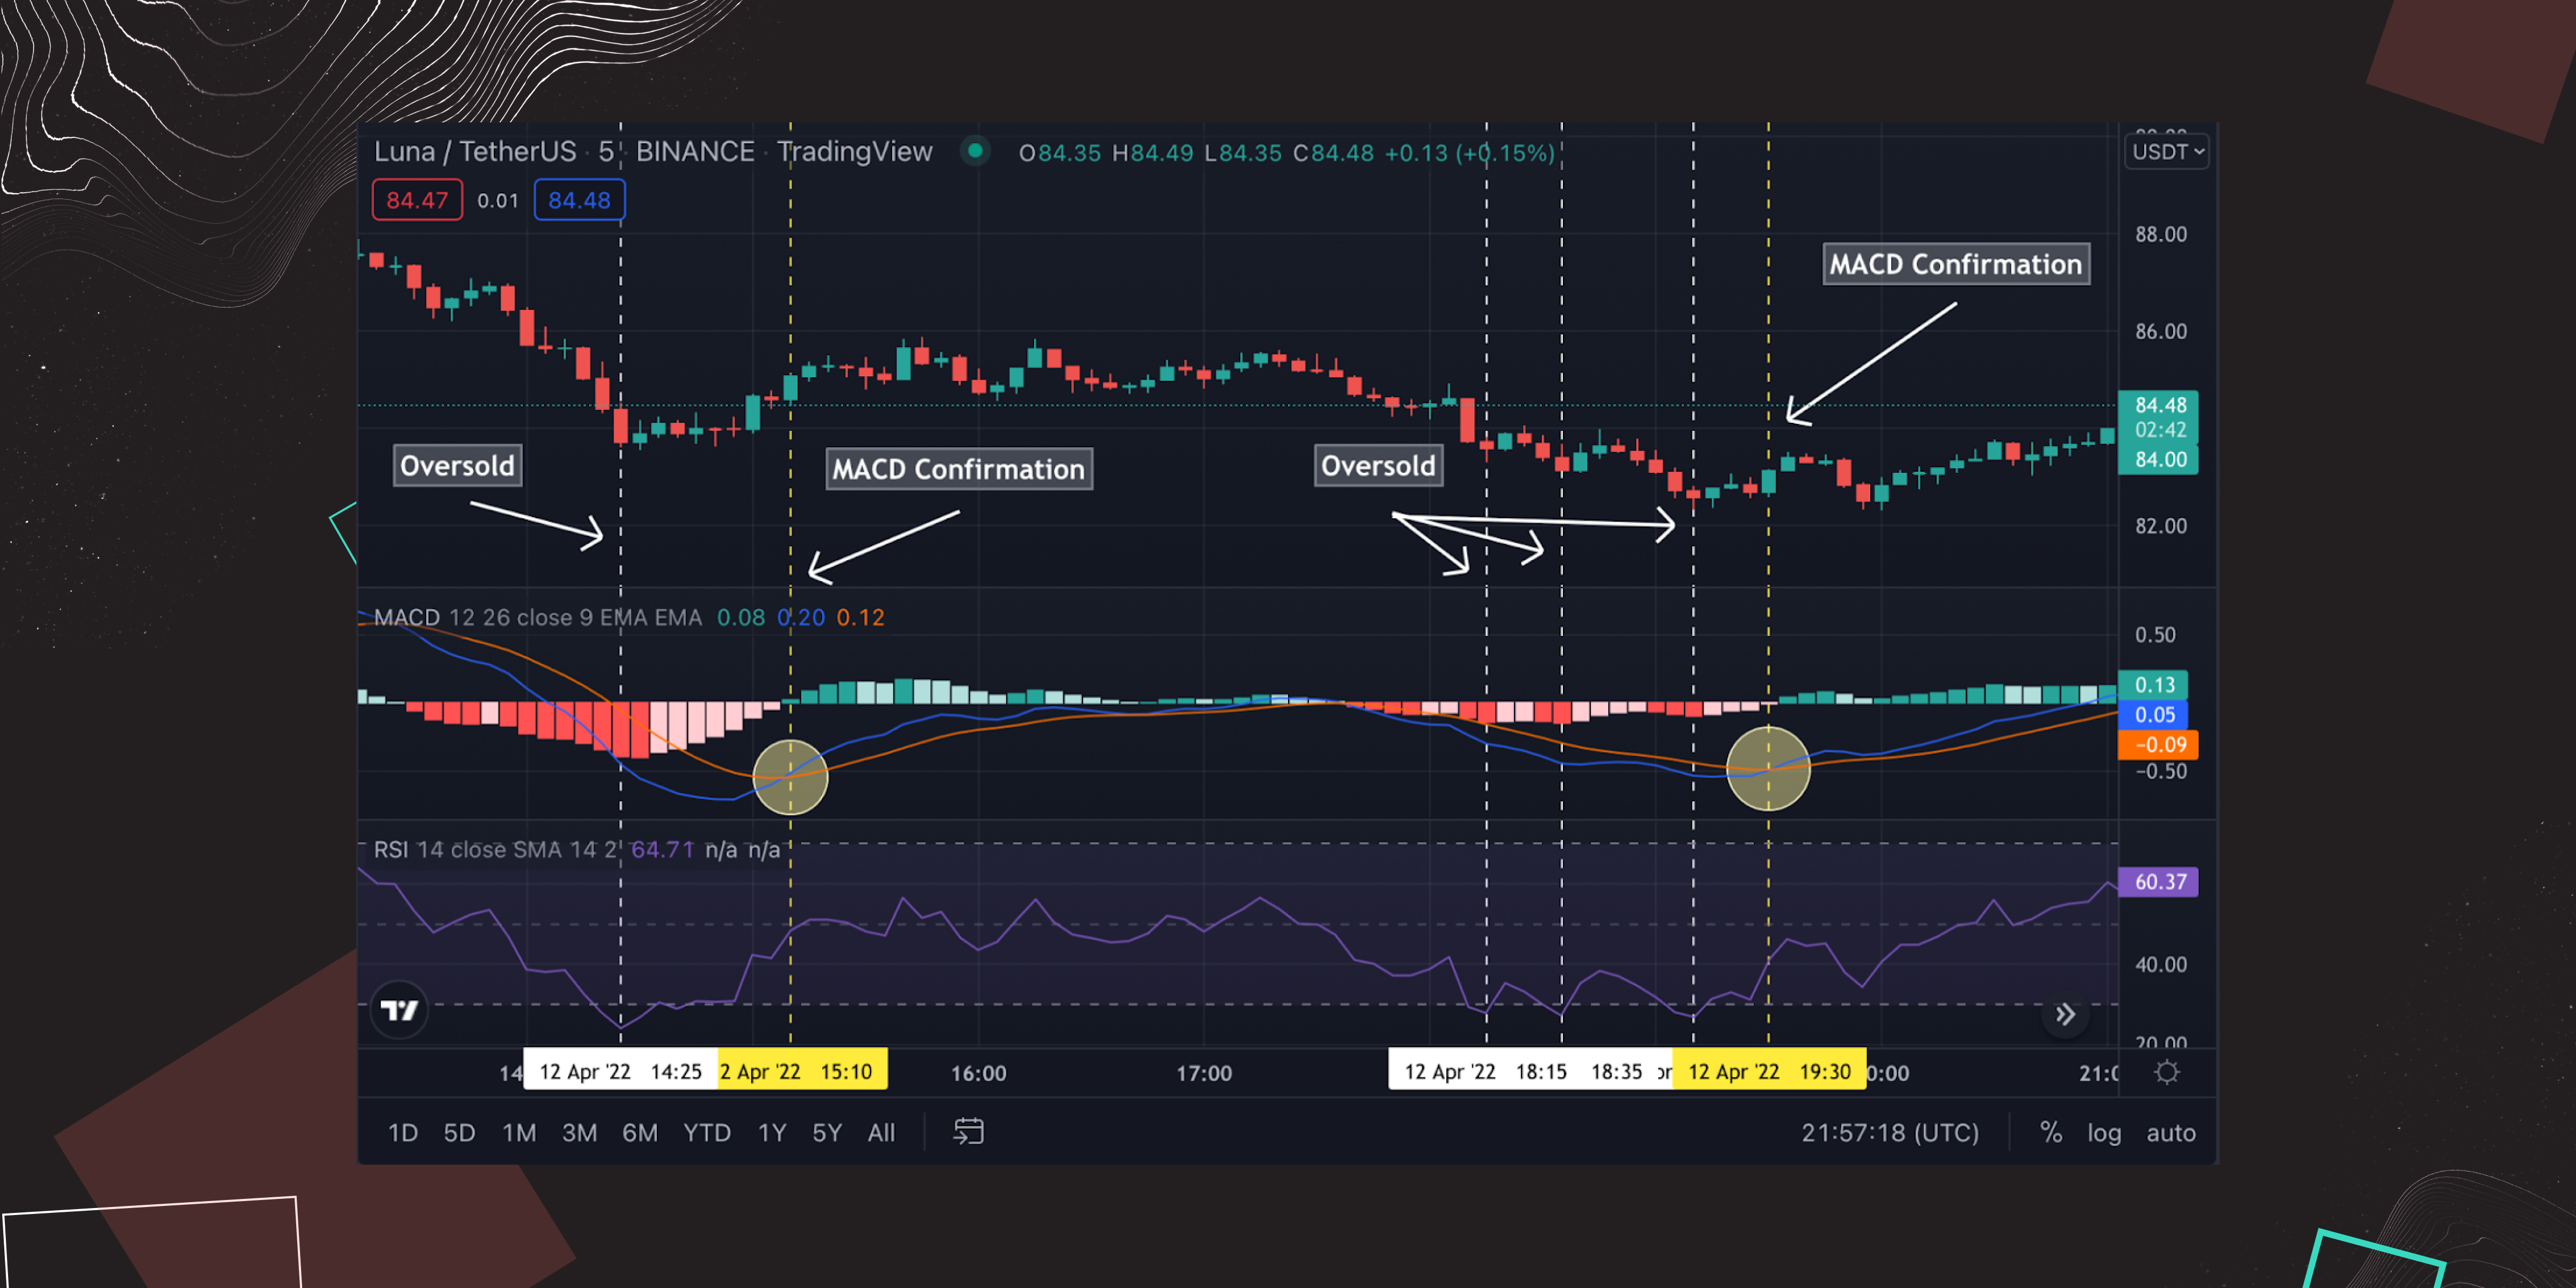
Once the RSI hits an oversold area, suggesting a potential long entry, you should wait for the MACD to confirm that. If you see MACD crossing above the signal line, you can feel confident enough to open a long position.
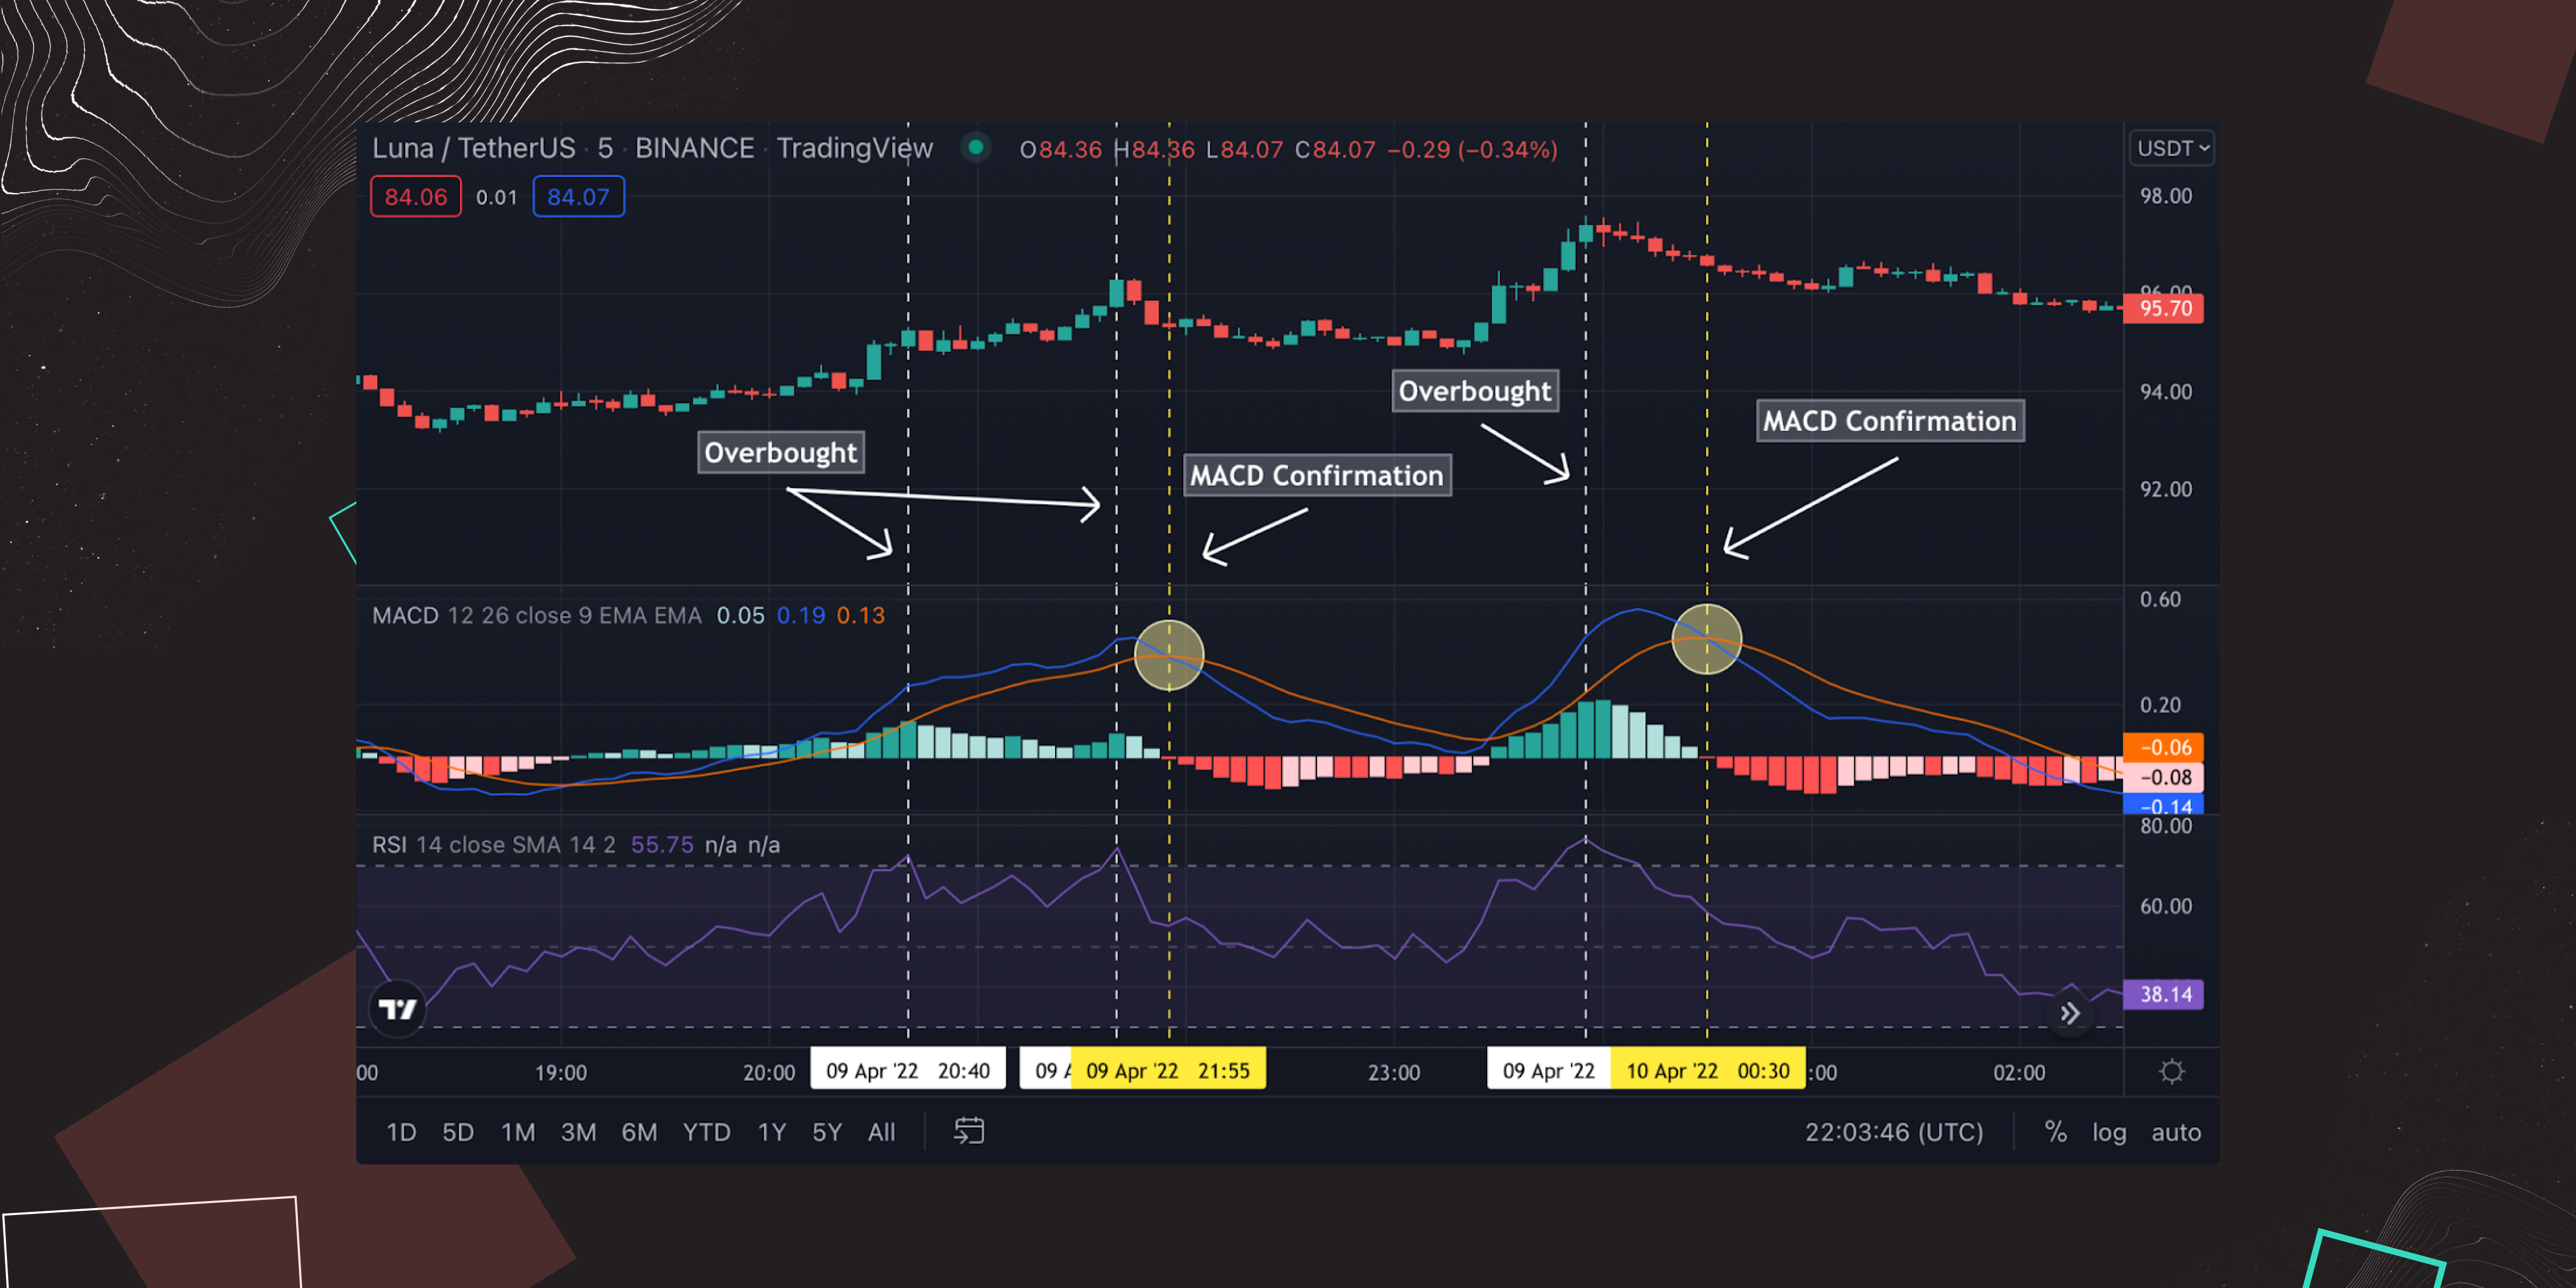
When RSI reports overbought market conditions, wait for the MACD to confirm a downtrend momentum. If the MACD line crosses below the signal line, open a short position without second thoughts.
You can also use the RSI line to identify, and verify trend direction. The line above 50 indicates an uptrend and below 50 indicates a downtrend.
Understanding how MACD and RSI work on their own allows us to utilize them in tandem to get an extra confirmation on the strength or weakness of the trend.
Now that you know how to use MACD and RSI together to make more efficient trades, there are plenty of other indicators you can apply to your MACD and RSI cryptocurrency trading strategy. Simple moving average or Bollinger bands can come in handy when validating trading opportunities. The best way to learn something is to try it in practice!
- Find trading pairs that you are interested in on TradingView,
- Set up a MACD indicator and start looking for a good entry position.
- Connect your Metamask wallet to bitoftrade and start making money.
- For more convenience, we don’t ask you for identification (KYC procedure) or any other mandatory actions that jeopardize your anonymity or the safety of your assets - just connect your MetaMask wallet and click on the “Start Trading” button!
MACD vs. RSI
Though both indicators are considered momentum oscillators, the way they showcase trading opportunities are quite different.
While MACD considers the correlation of 2 EMAs to indicate potential entry positions, RSI measures an asset's price change in relation to recent price levels to determine overbought and oversold market conditions.
These 2 indicators measure different factors, and that’s why they might occasionally yield conflicting results. But when used together, they can offer analysts a more robust technical overview of a market.
Conclusion
MACD is an excellent addition to the toolbox of any trader. Thanks to its simplicity and reliability, every trader, regardless of experience and knowledge base, can leverage the MACD indicator to determine the market trend and confirm momentum.
MACD produces a lot of trading signals, so it is even more important to properly filter out the false ones and take action on the right ones. Keep in mind that trading with a MACD indicator by itself may be a good start to learning about its specifics, but this strategy will not benefit your profit in 10 out of 10 cases. Experienced crypto traders agree that it is always a good idea to complement your technical analysis with additional indicators, such as RSI or SMA.
The best part about the MACD indicator is that it can be found at almost every crypto exchange. We personally recommend practicing trading indicators on TradingView. The platform has a rich set of various trading indicators and allows traders to utilize them on charts that are updated in real-time.
When you spot a potentially profitable long or short position, take a shot on this trading opportunity on bitoftrade. There are not many non-KYC exchanges with decent liquidity, providing their users with the same variety of trading instruments as we do. Thanks to our simple and straightforward website interface, you can start trading with 0 background of cryptocurrency - all the resources are at your fingertips.
Explore more trading opportunities with the MACD indicator on one of the best non-custodial cryptocurrency exchanges existing today!