Chart patterns are the сore components of technical analysis that every trader has to use to succeed. Trading chart patterns based on human behavior tend to repeat themselves. Furthermore, we can easily predict human behavior after these patterns too. Like all the patterns in nature, crypto patterns repeat themselves repeatedly and are relatively easy to spot. They help us determine if the trend will continue or if it is more likely to change its direction in the future since these are all patterns. Moreover, traders use crypto trading chart patterns to simplify or speed up the perception of the current cryptocurrency market situation.
Chart patterns are generally formed and are best visible on candlestick charts. Candlesticks provide traders with a range of information about the asset price, such as open price, close price, high and low prices. In addition, each candle gives a brief overview of the trading results over a specific time period specified by the trader. Crypto traders mainly use candlestick charts for identifying trading patterns and setting up their trades based on that information, as they are considered much more informative than line charts. That makes candlestick or crypto chart patterns appear.
This article will cover some of the most common bullish chart patterns that every crypto trader has in their toolbelt and will guide you in identifying them on trading charts. So let's break everything down.
What Are Bullish Сhart Patterns?
Chart patterns are a visual representation of the predicted trend and type. The first classification parameter relates to the direction an asset price is supposed to go after the chart pattern is formed and detected: it can go up or down. When the chart pattern implies the price will go up, we classify it as a crypto bullish pattern. If it goes down - we classify it as a bearish pattern.
Crypto bullish patterns mark the reversal within or after a prior downtrend of an asset price. They serve as a signal for traders to go long, buy an asset, and make more profit from the trade when an asset price reaches new heights. Catching uptrend reversal is extremely important for a trader, as the lower an entry price of their position, the more profit the trader can make.
Bullish Reversal Patterns vs. Bullish Continuation Patterns: What's The Difference?
There are two main trading patterns that we can determine as bullish on the crypto market: bullish trend reversal patterns and bullish continuation patterns. When a bullish or bearish chart pattern forms, it predicts a future asset price movement direction. Let's look at these two types individually.
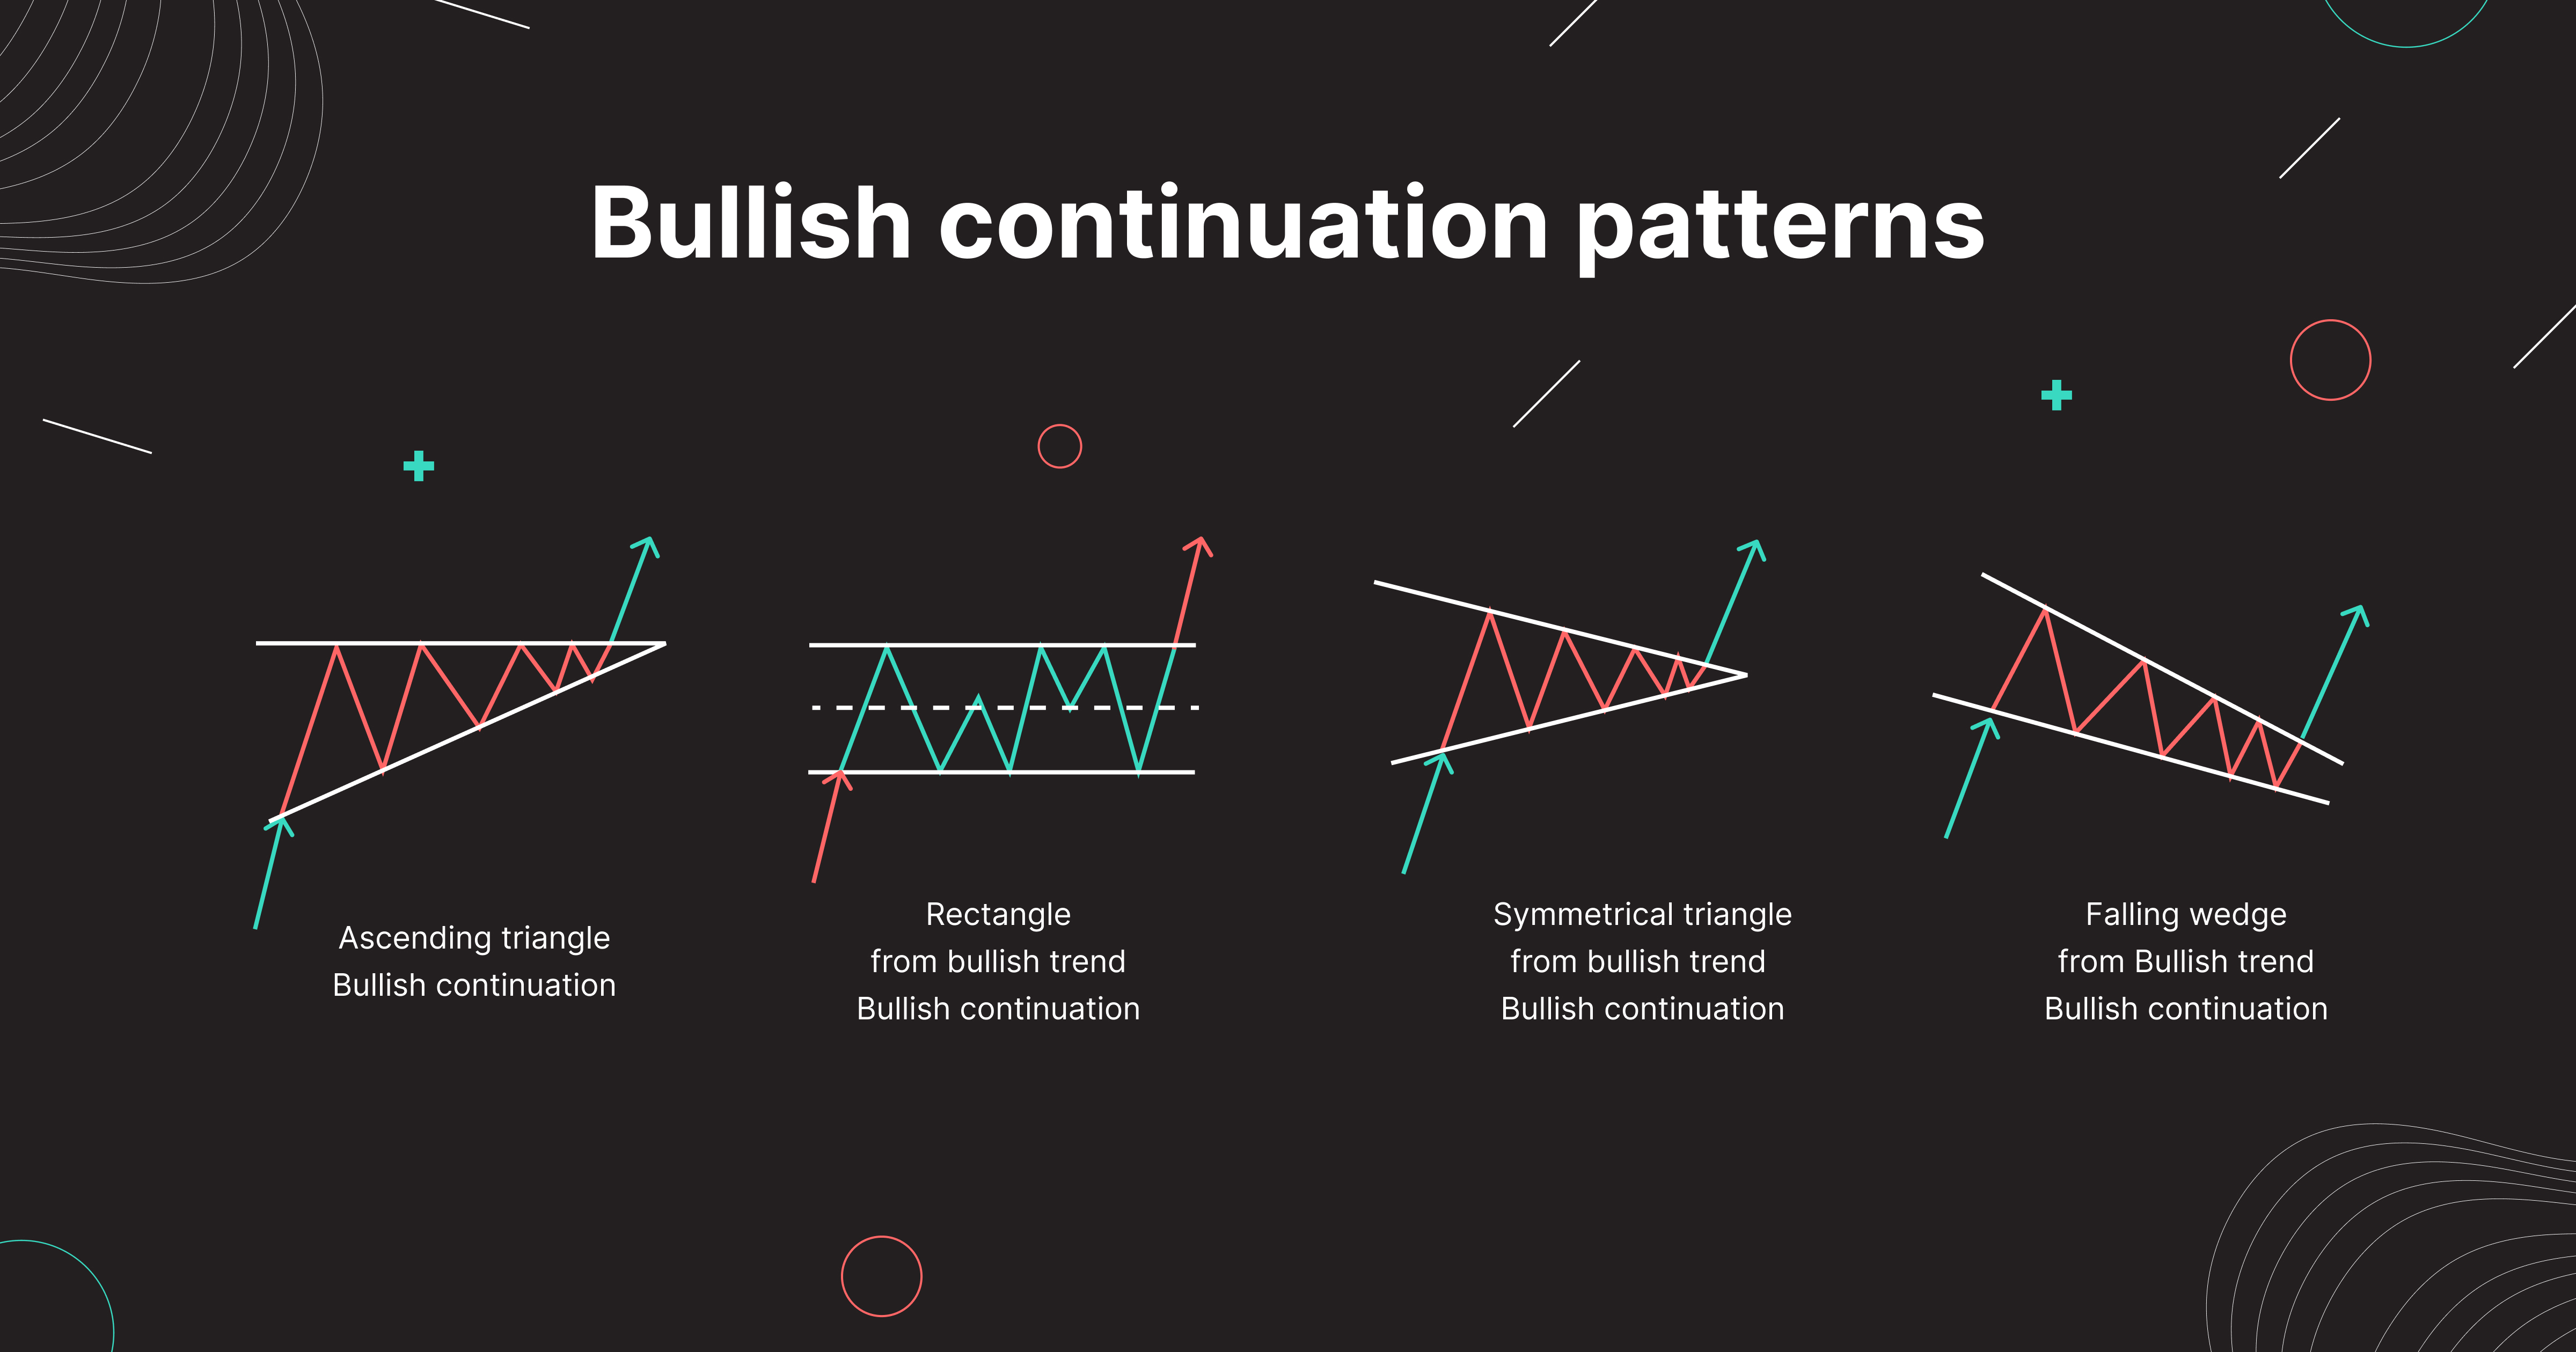
Bullish continuation patterns mean that the price will continue moving in the same direction after the continuation pattern forms. In short, bullish trend continuation patterns help traders predict the continuation of a crypto’s price growth, providing traders with approximate hints on what is an entry and exit price for the bullish position.
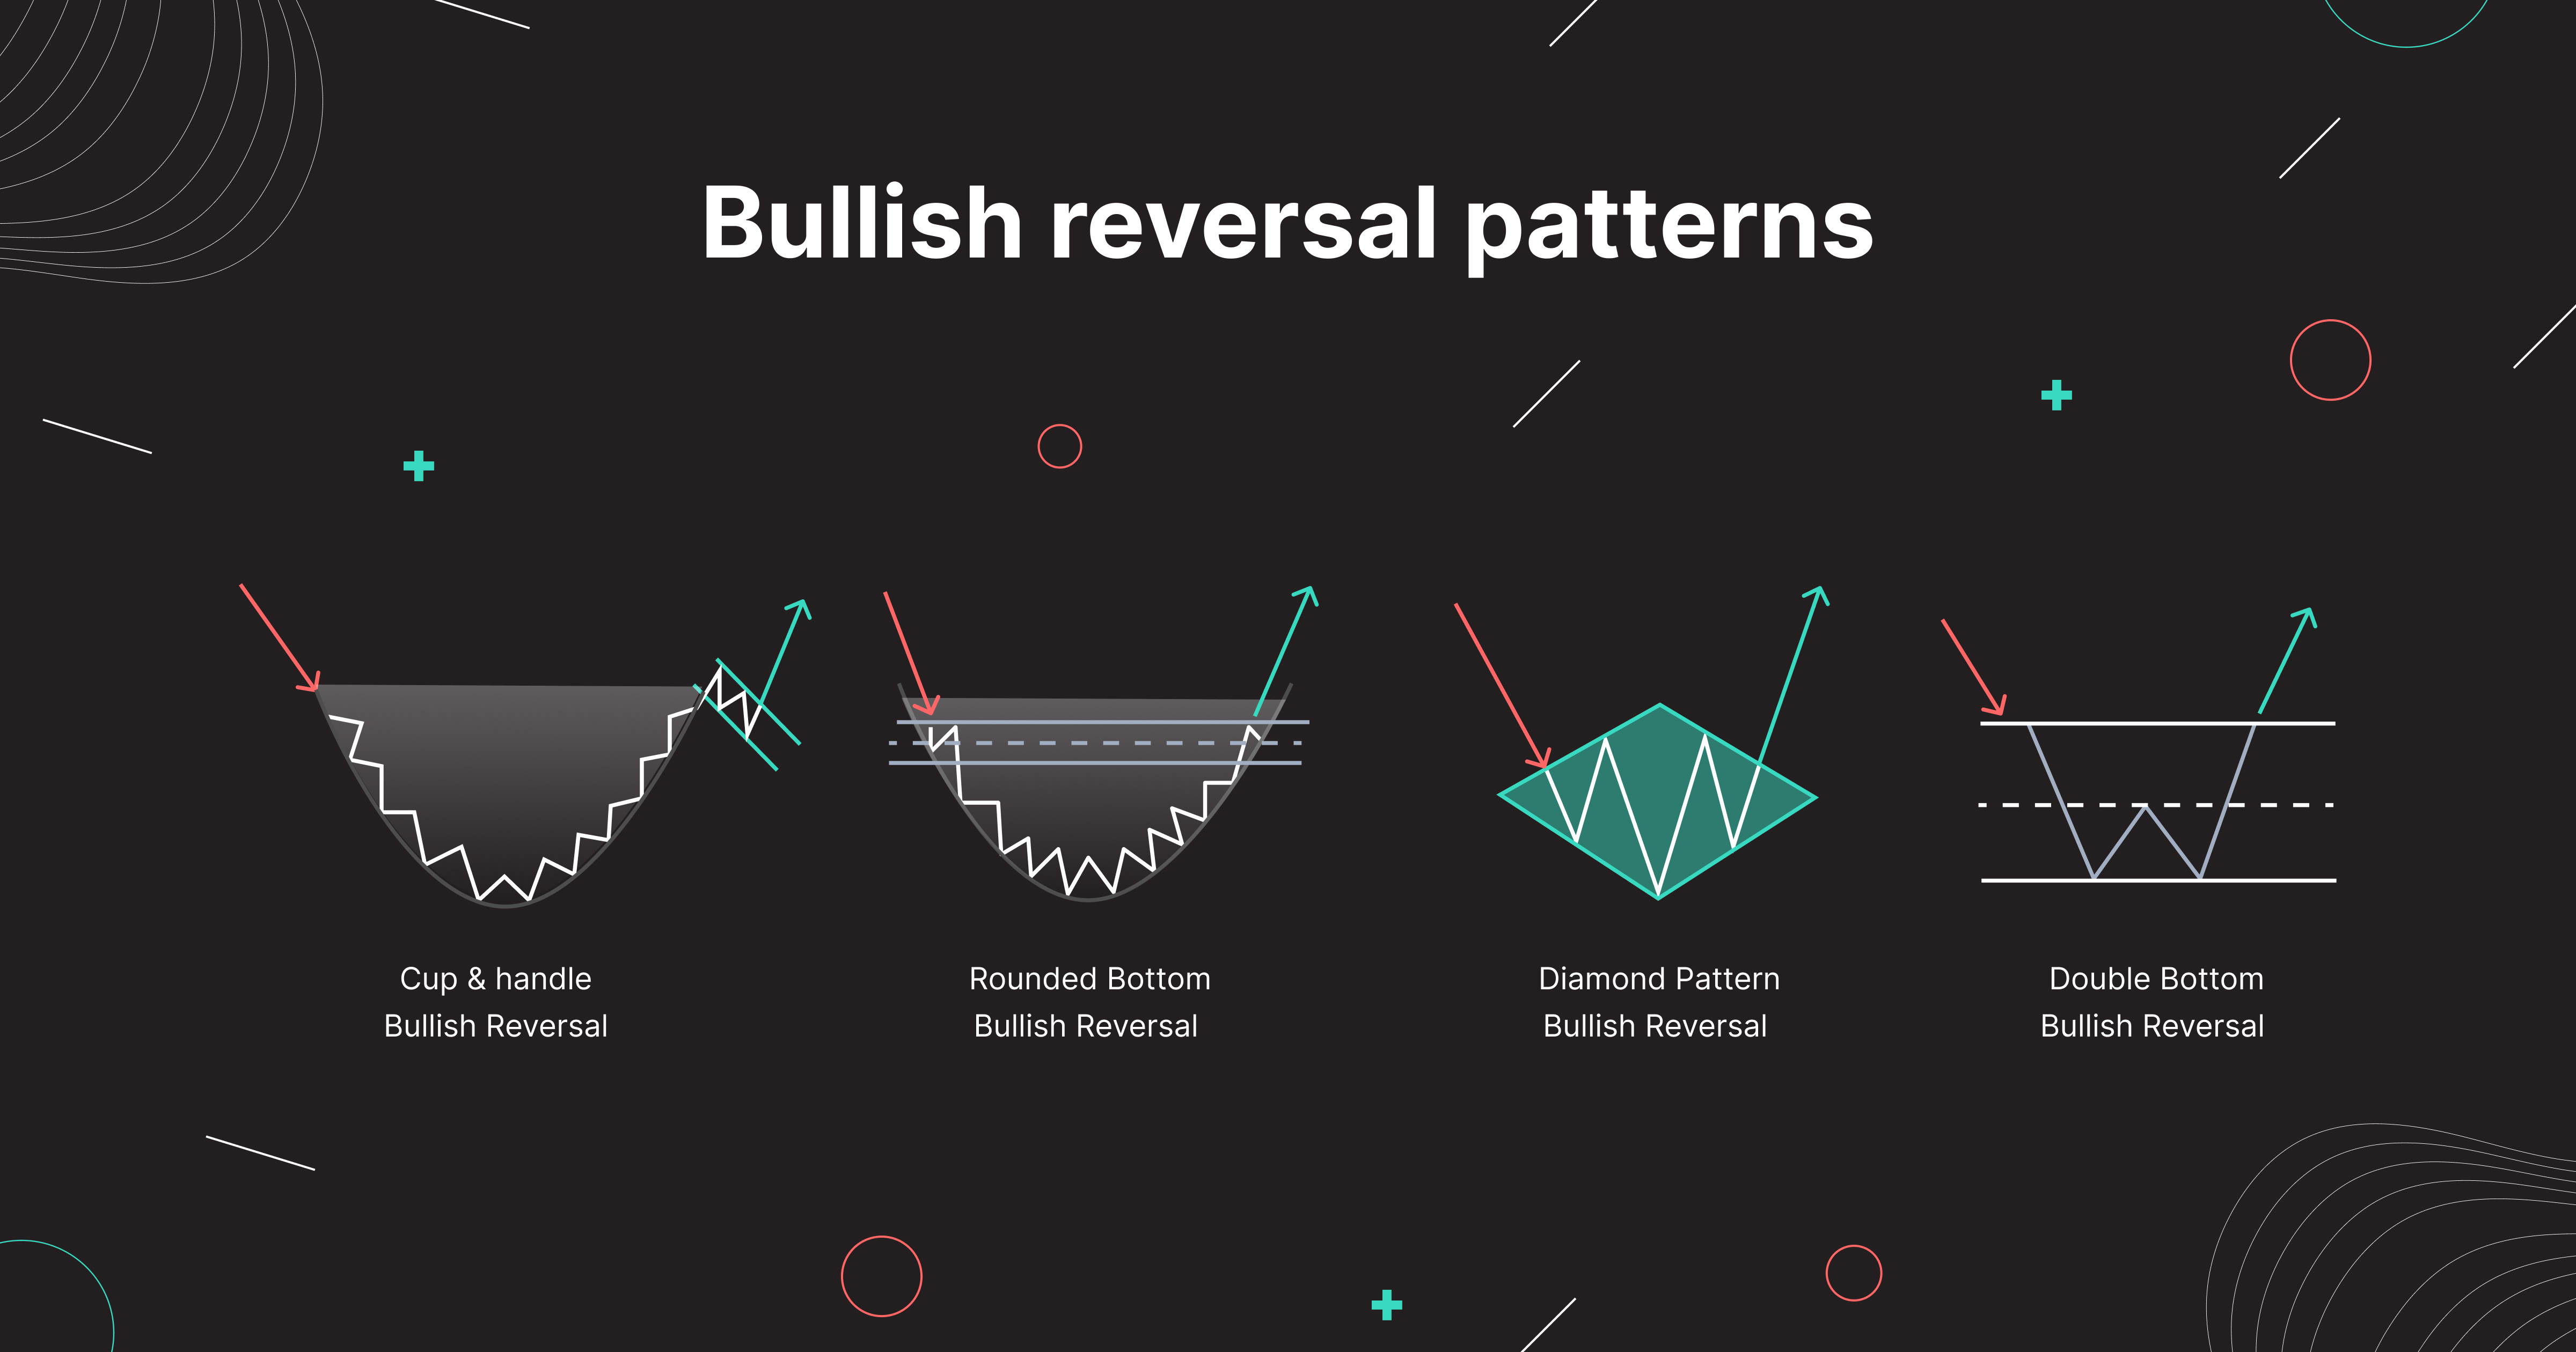
Bullish Reversal Patterns imply that the current token's price downturn will end soon, possibly reversing to an uptrend. In a nutshell, these types of reversal patterns signal a trend reversal to the upside and give traders buy signals and possible profit targets.
5 Best Types Of Bullish Candlestick Patterns For Crypto Trading
As we told you previously, chart patterns may help traders identify potential entry points and establish price targets and time exit points. However, it would help if you didn't rely only on these patterns as key crypto trading indicators. They can become invalidated in the middle of their performance and produce the opposite trading results. Therefore, it’s better to use them in combination with trend lines, various technical indicators, and oscillators to confirm signals detected and your trading ideas.
There are five bullish crypto trading patterns to watch for that are considered the most accurate and effective by successful crypto traders. Let's take a deep dive into these top five trading signals.
Inverse Head And Shoulders Bullish Trading Pattern
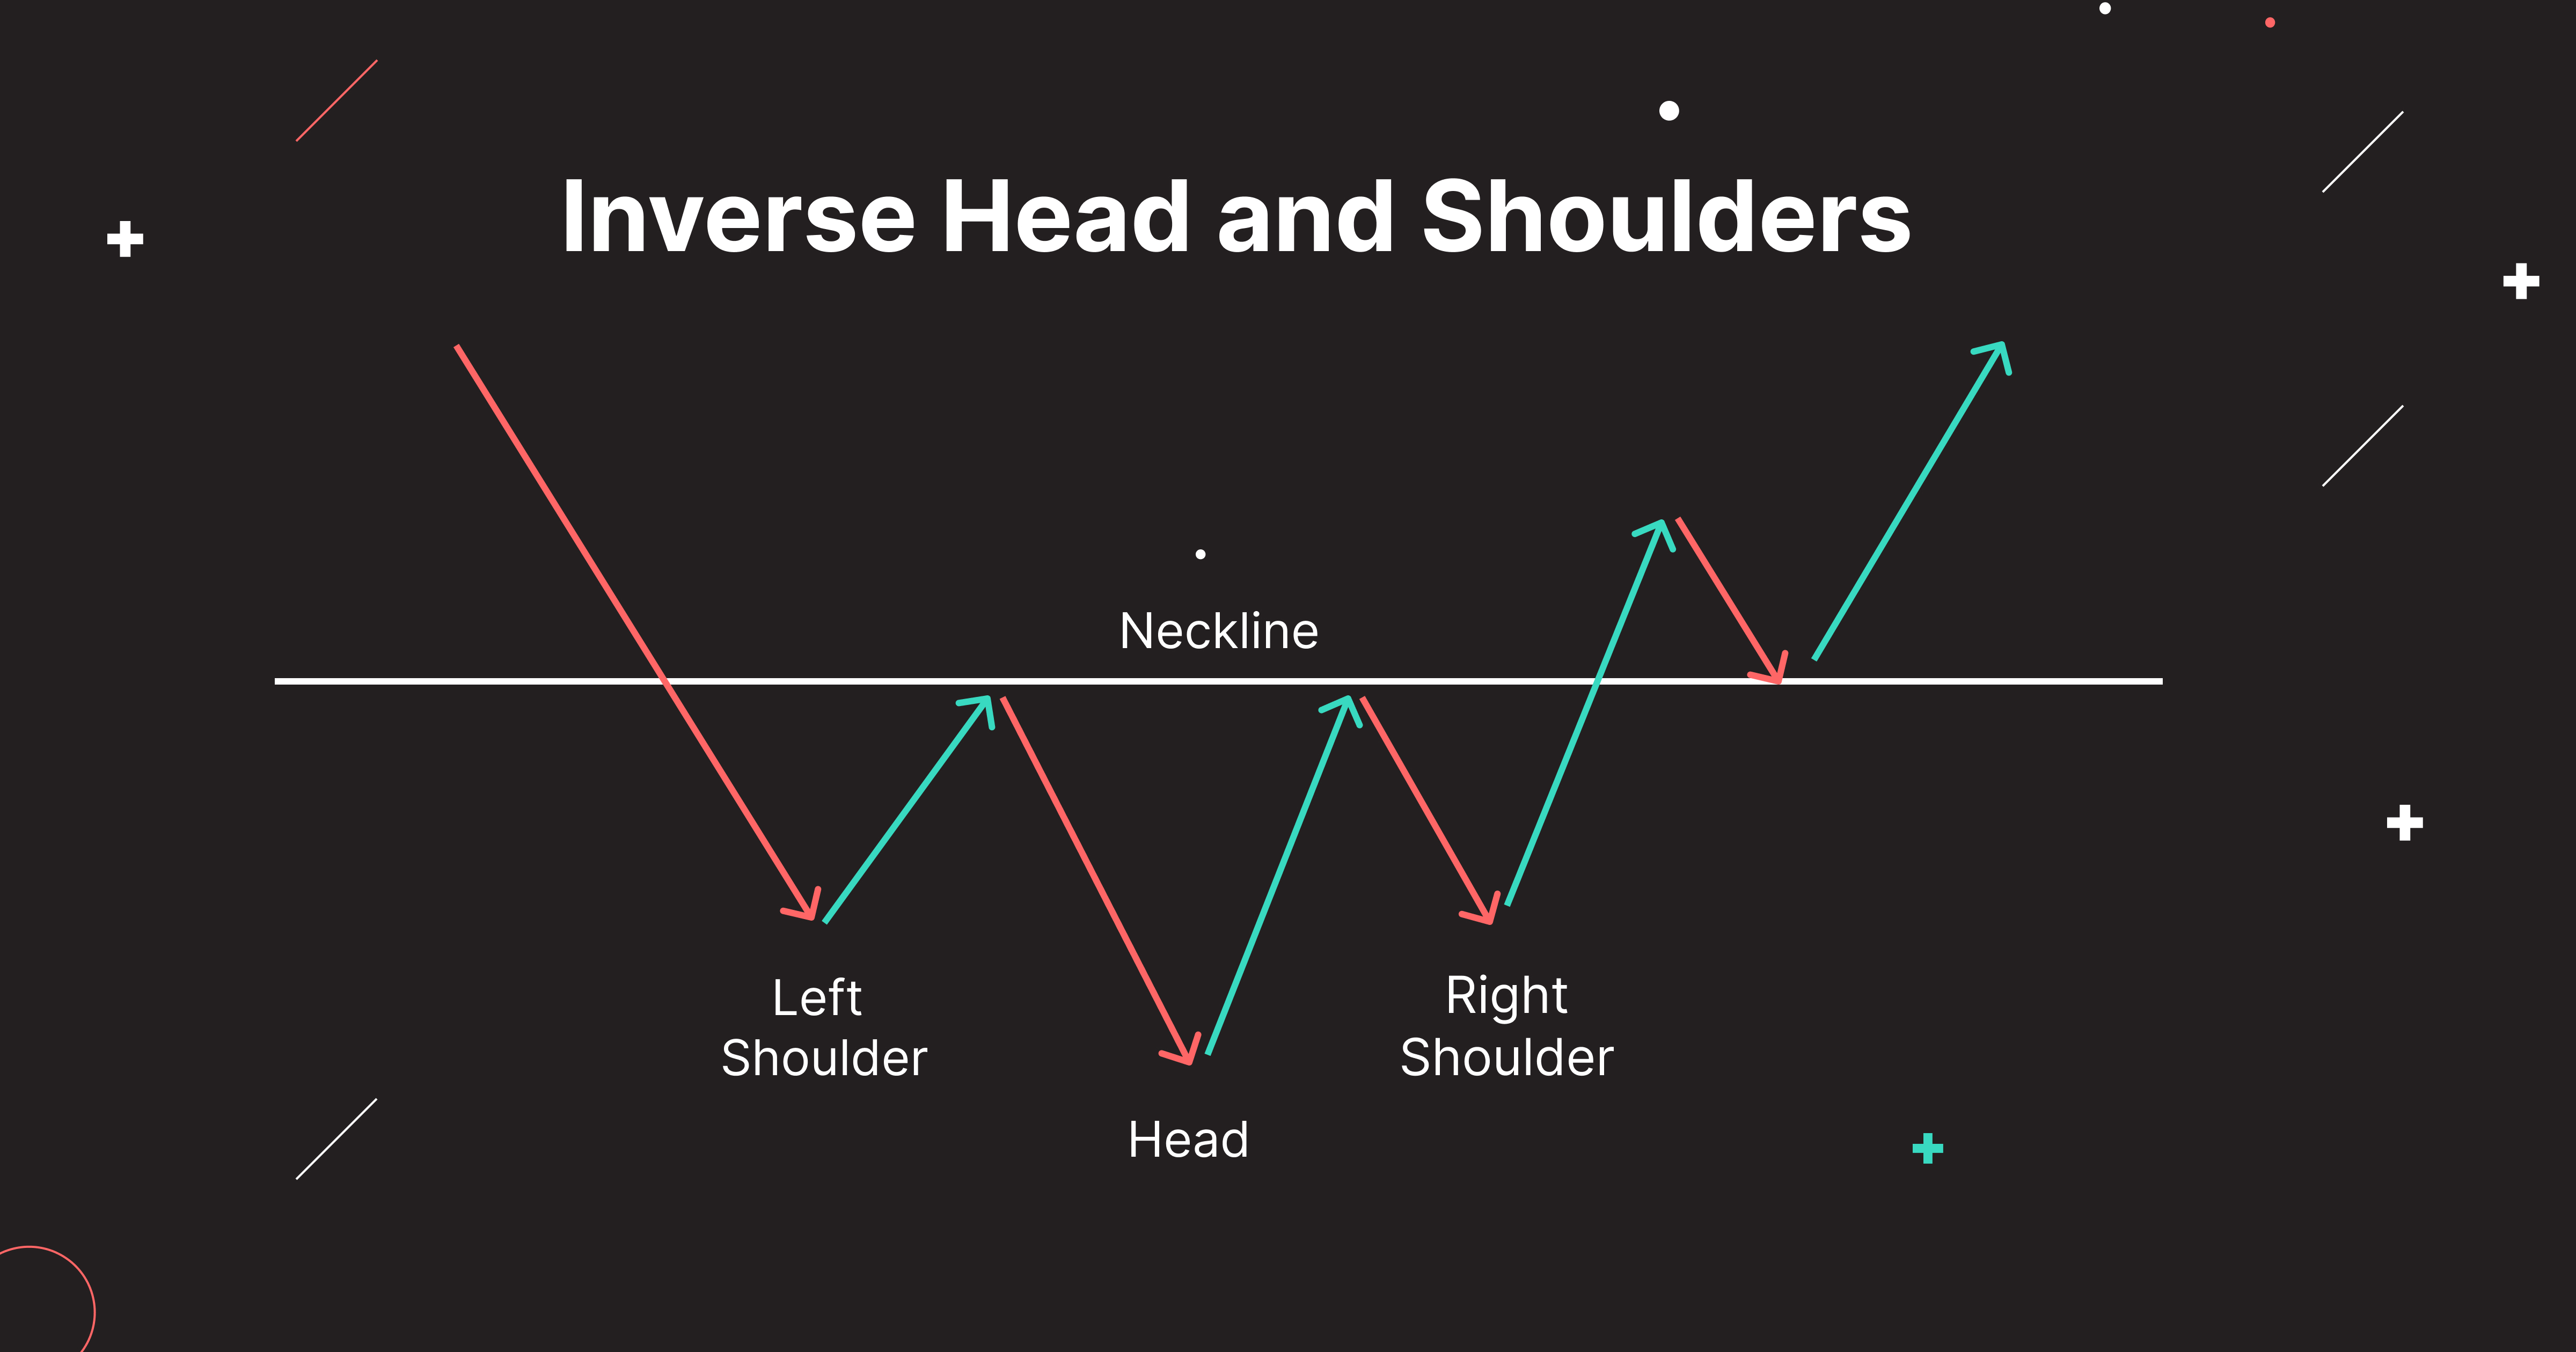
The head and shoulders chart pattern is a popular and easy-to-spot figure commonly used in a bearish market showing a baseline “neck” with three peaks:
- The middle and the highest peak are accurately named "head."
- The two peaks on the sides are named "shoulders" as they resemble the shoulders of a person.
Inverse head and shoulders pattern, also called head and shoulders bottom, is a bullish trend reversal pattern that usually begins with a downtrend and has the same configuration as the standard head and shoulders pattern but flipped or turned on its head.
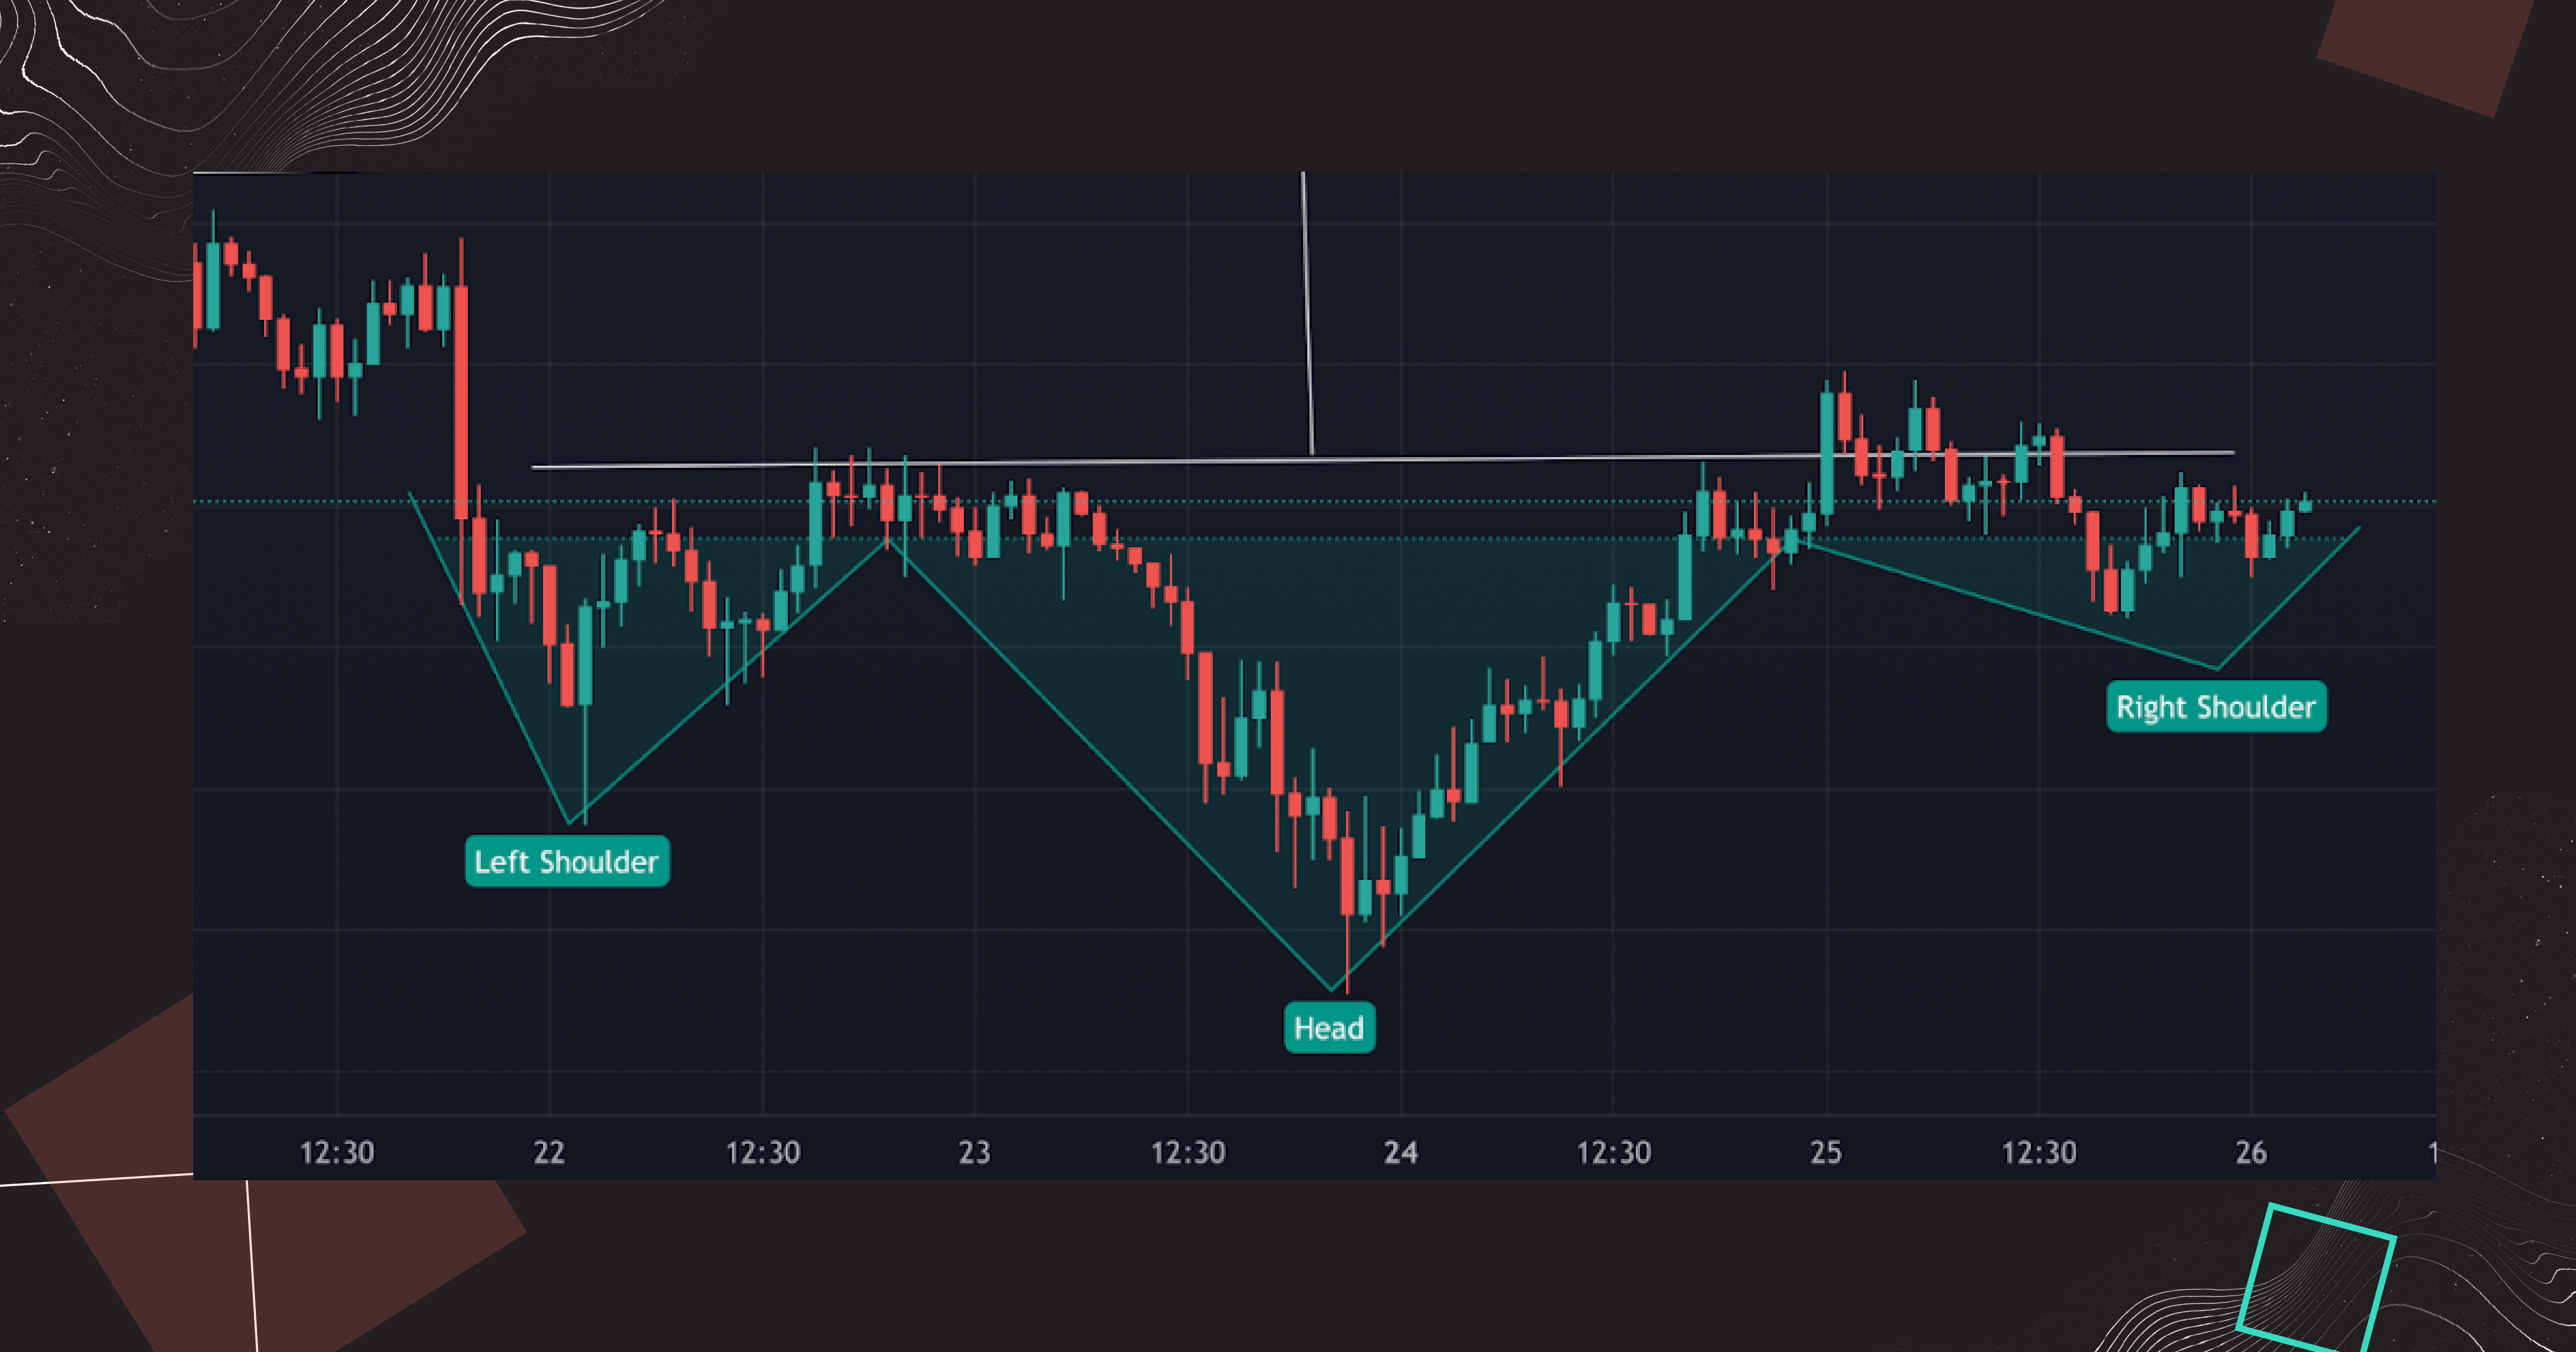
The practice example of inverted head and shoulders pattern on the chart.
Once you have spotted an inverted head and shoulders pattern in a downtrend and the right shoulder of the figure has formed, you can place a buy order after the price breakout the neckline. However, before entering the position, you need to wait for that moment when a candle forms above the neckline to avoid false breakout signals.
Cup And Handle Pattern
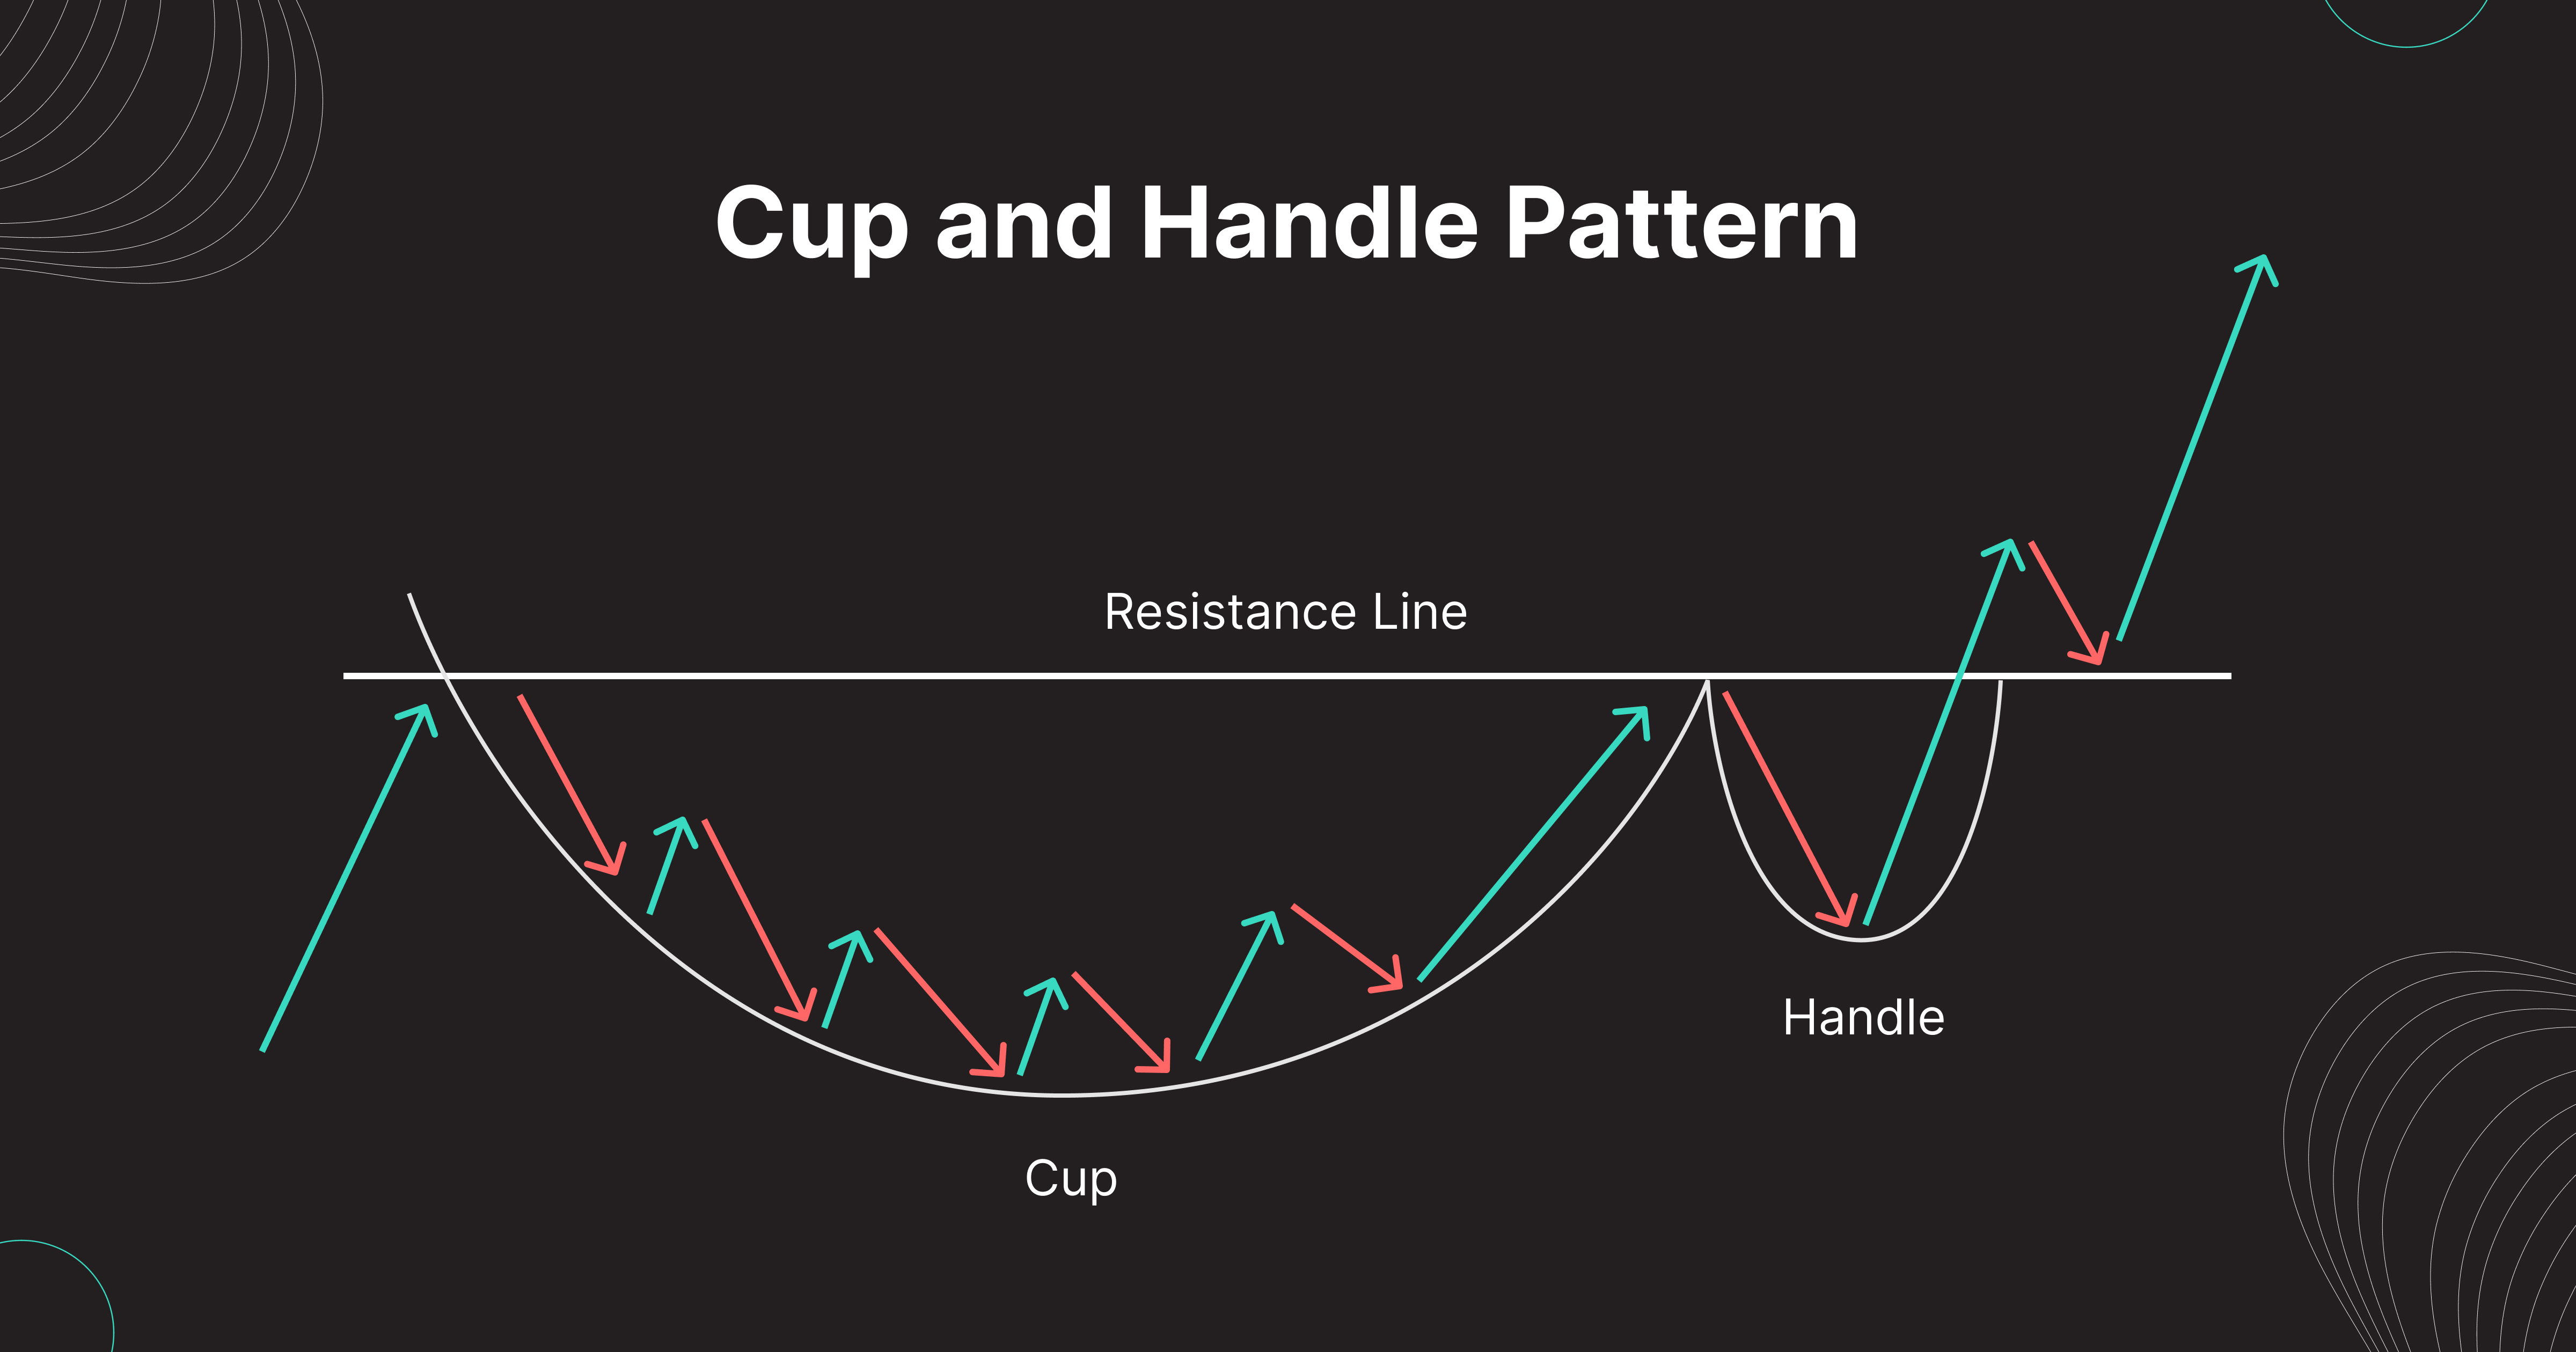
The cup and handle pattern is the bullish continuation pattern in a chart, which appears when the price increase needs to catch its breath and pause for a while. Let’s explore the picture above.
- The first cut half of the pattern starts to form when an uptrend reaches the resistance level and then reverses direction and moves down.
- An asset price corrects a portion of a previous uptrend, which finishes it off, or when the market reaches support level and reverses direction again. This time, moving up and forming the bowl shape, the “cup,” while hitting back to the same level as the start of the cup.
- Then, a crypto asset is traded sideways, forming the "handle" which comes back to the same price level and may indicate a further cup and handle pattern breakout. The handle is typically ⅓ - ⅔ the height of the cup.
- Once you spot a cup and handle, you need to wait for the resistance line breakout and enter your trade just after it’s confirmed. The resistance line breakout in this scenario is considered a strong entry signal for crypto traders.
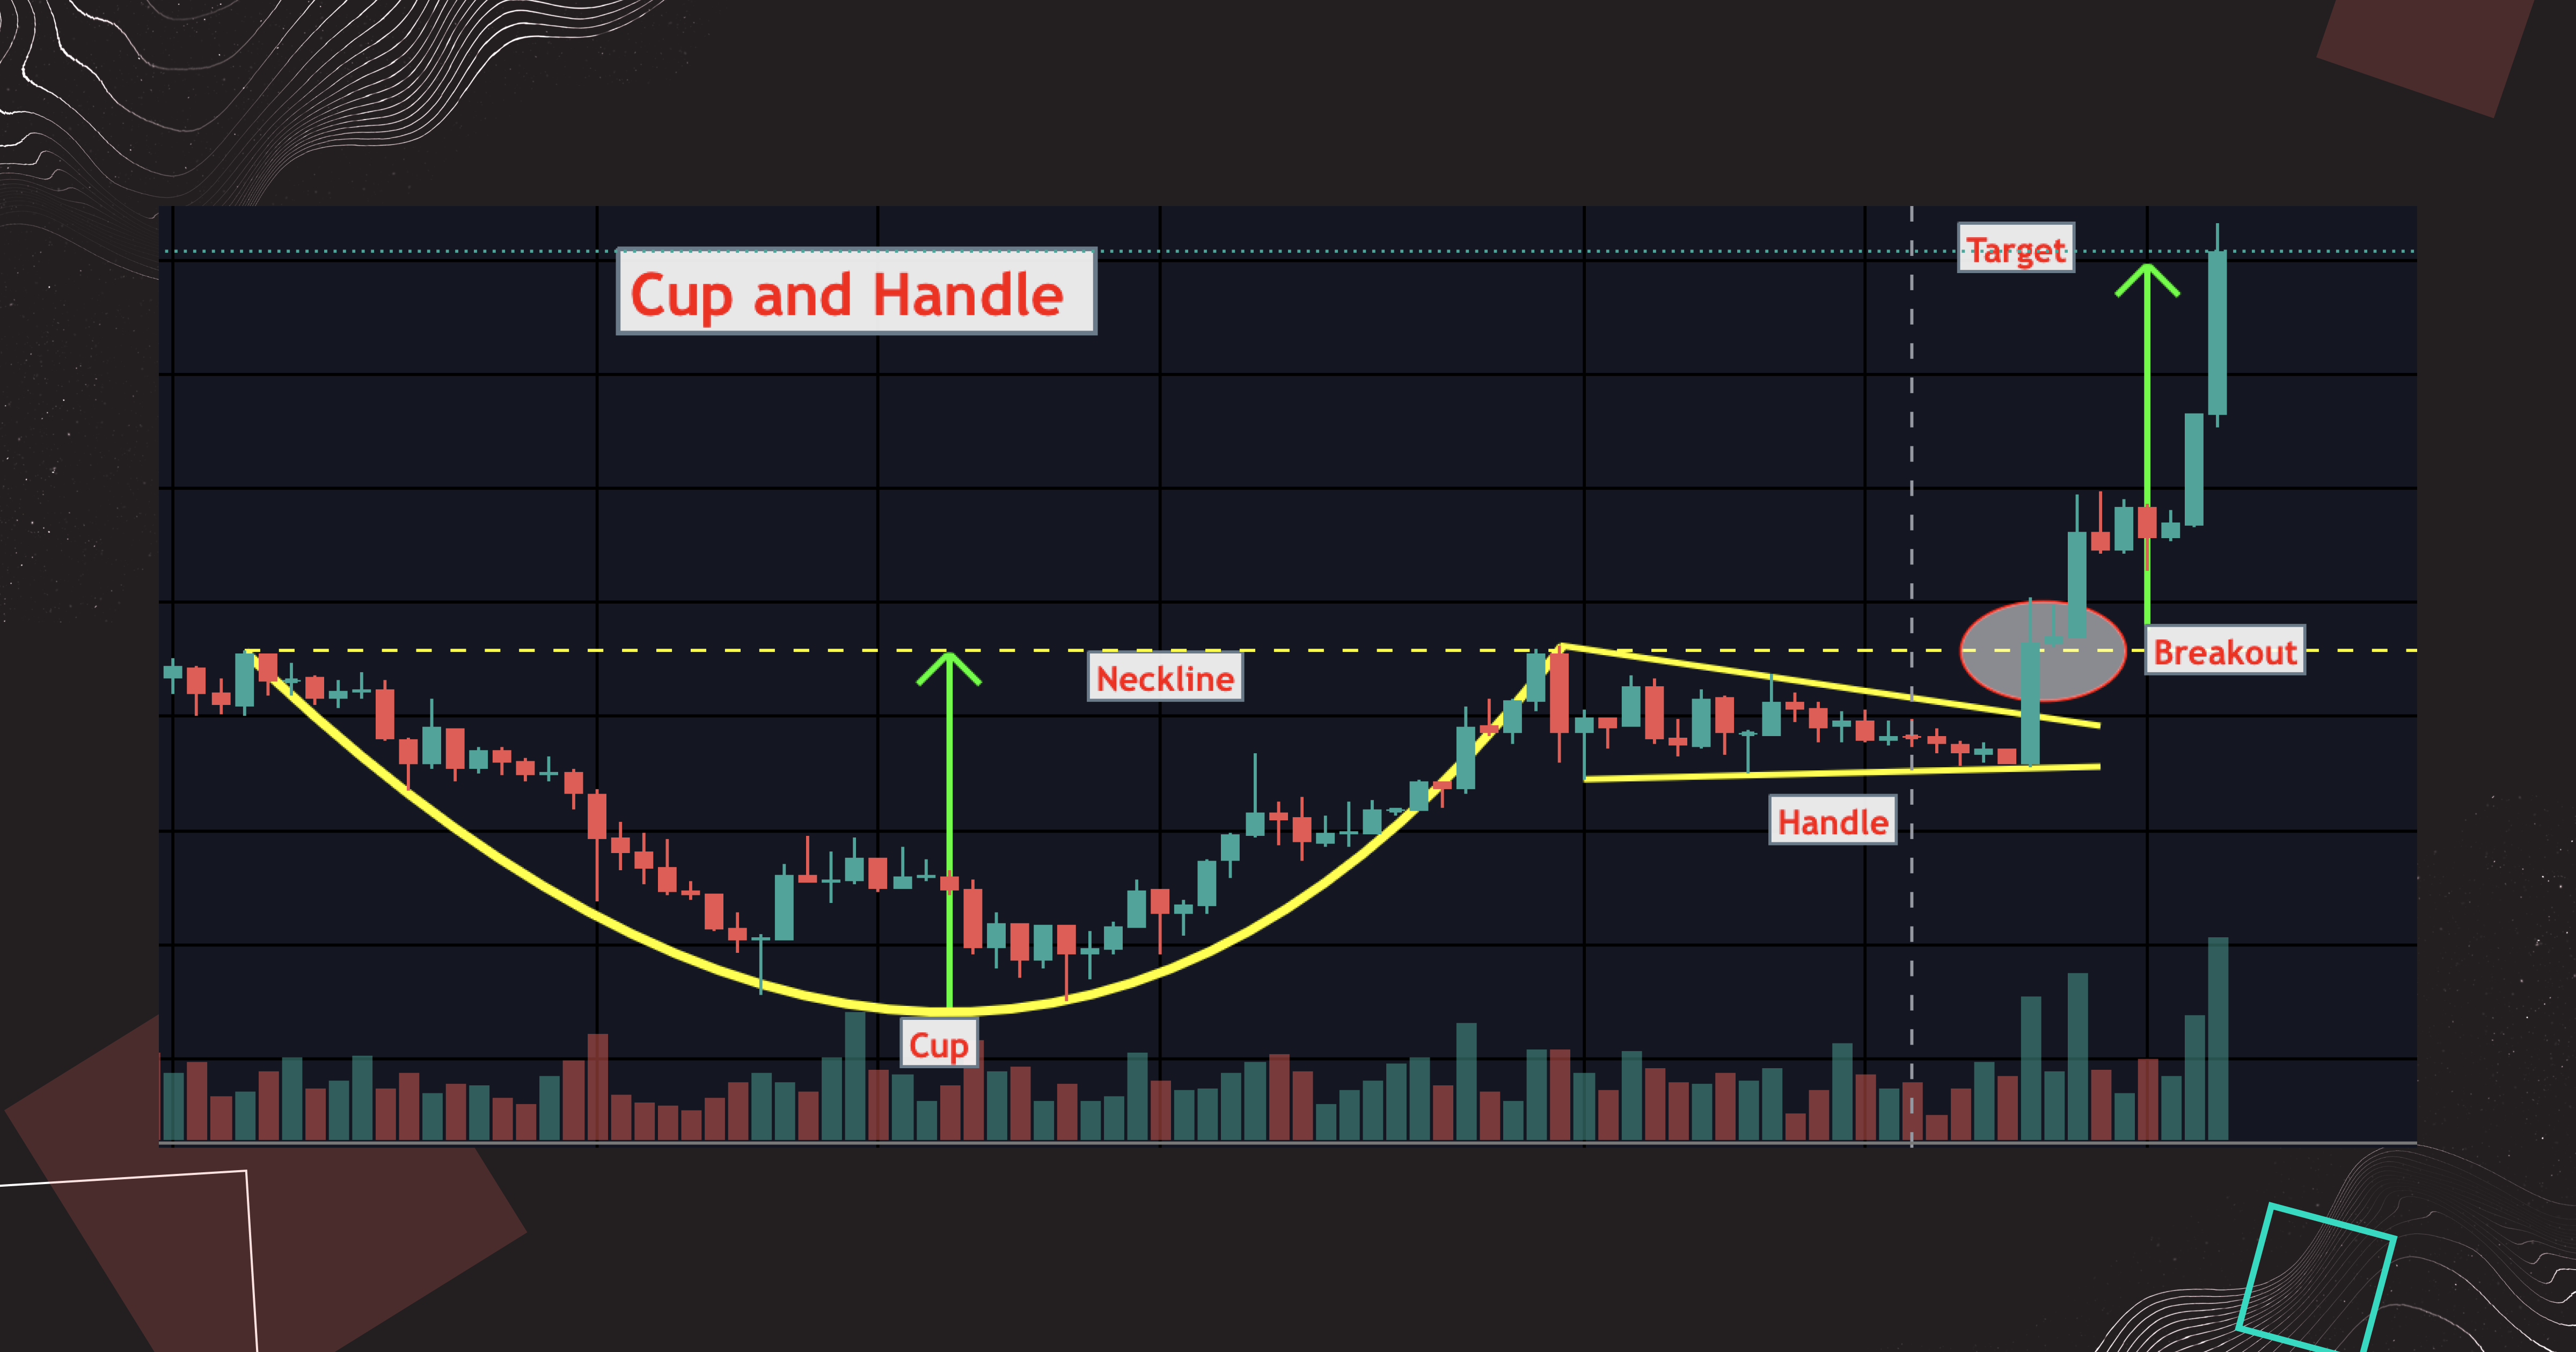
The practice example of cup and handle chart
However, it would be wise to seek additional confirmation by other indicators, such as trading volume spike, before entering the position. High trading volume might indicate that new investors are buying assets, increasing prices at the same time.
Bullish Pennant Chart Pattern
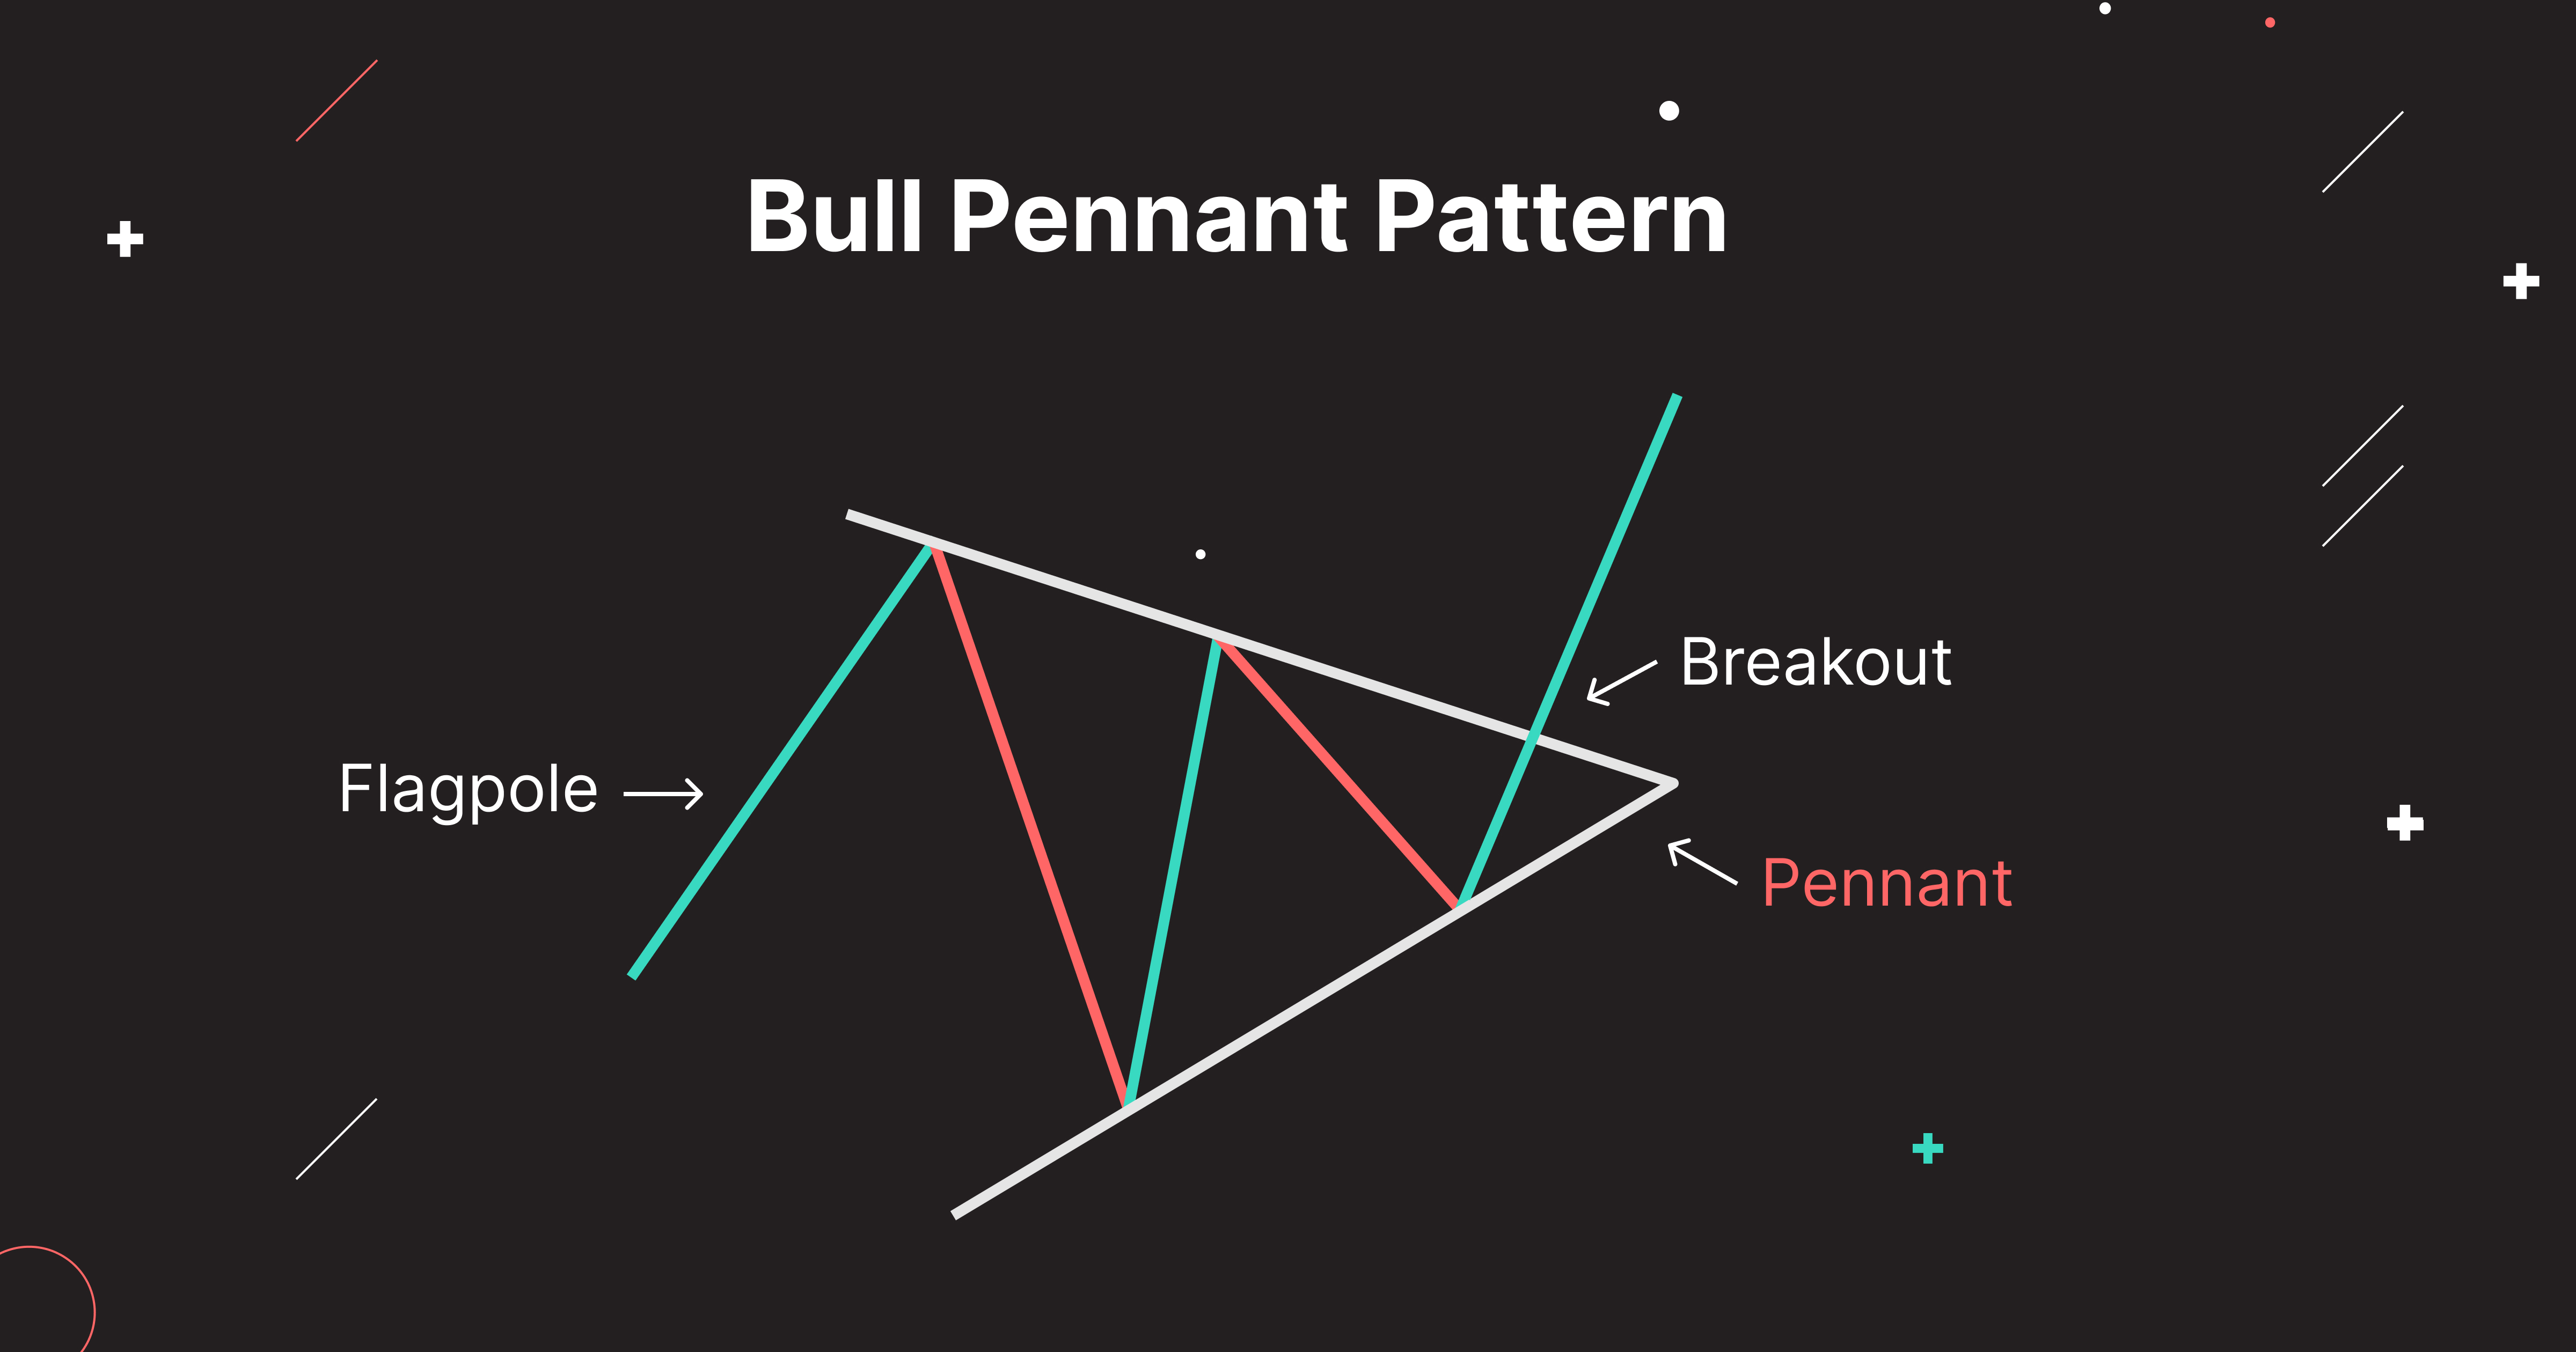
The pennant pattern is a continuation pattern formed by a vertical rise in a token's price, followed by a short-term consolidation zone that acts like a diminishing trading range, while the price range is getting tighter and tighter as trading continues.
The figure looks like a small symmetrical triangle consisting of many candles. Depending on the direction of the trend, the pennant pattern can be either bearish or bullish.
A bull pennant pattern is a bullish continuation candlestick pattern that implies an uptrend will continue once the consolidation period has ended. The pennant forms from the following parts:
- an ascending flagpole,
- a period of consolidation,
- a subsequent breakout,
- and the uptrend continuation.
Usually, experienced traders wait for a bullish breakout above the resistance level to take advantage of the renewed bullish momentum, enter the position, and close a profitable trade.
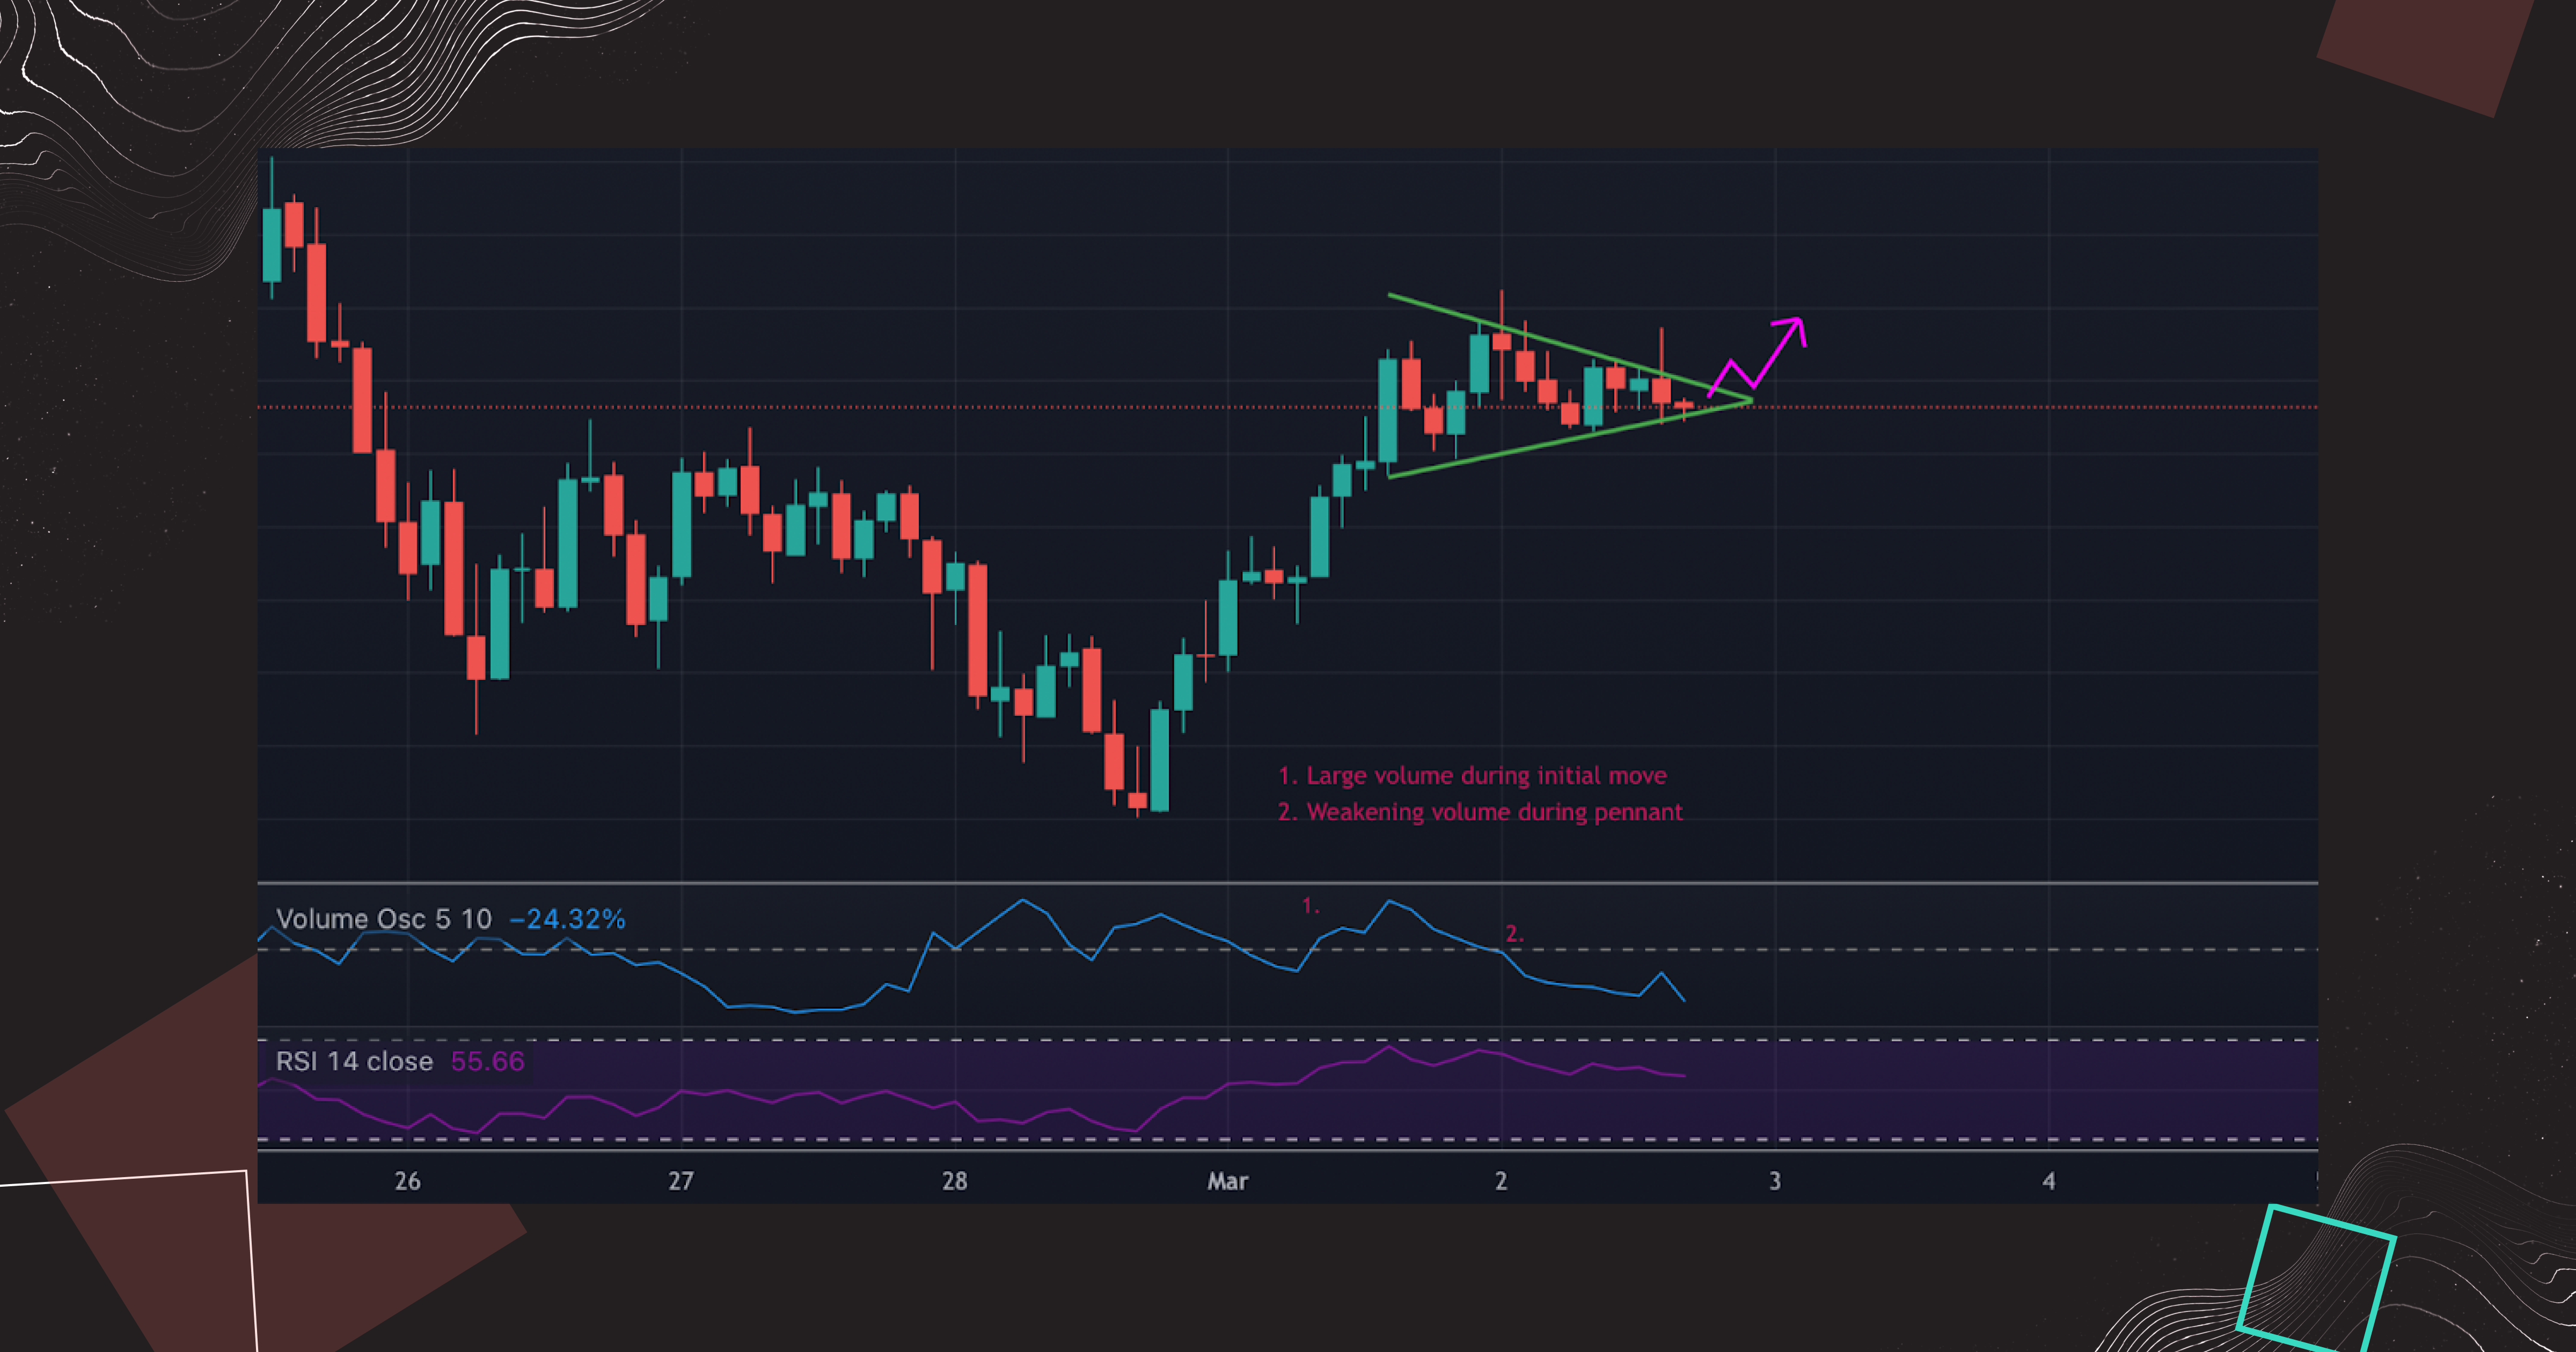
The practice example of crypto bullish pennant pattern on the chart
We can identify this pattern from its initial bullish solid move to the upside, followed by a pennant forming. The pennant forms when the price highs are getting lower and lows getting higher.
Bull Flag Chart Pattern
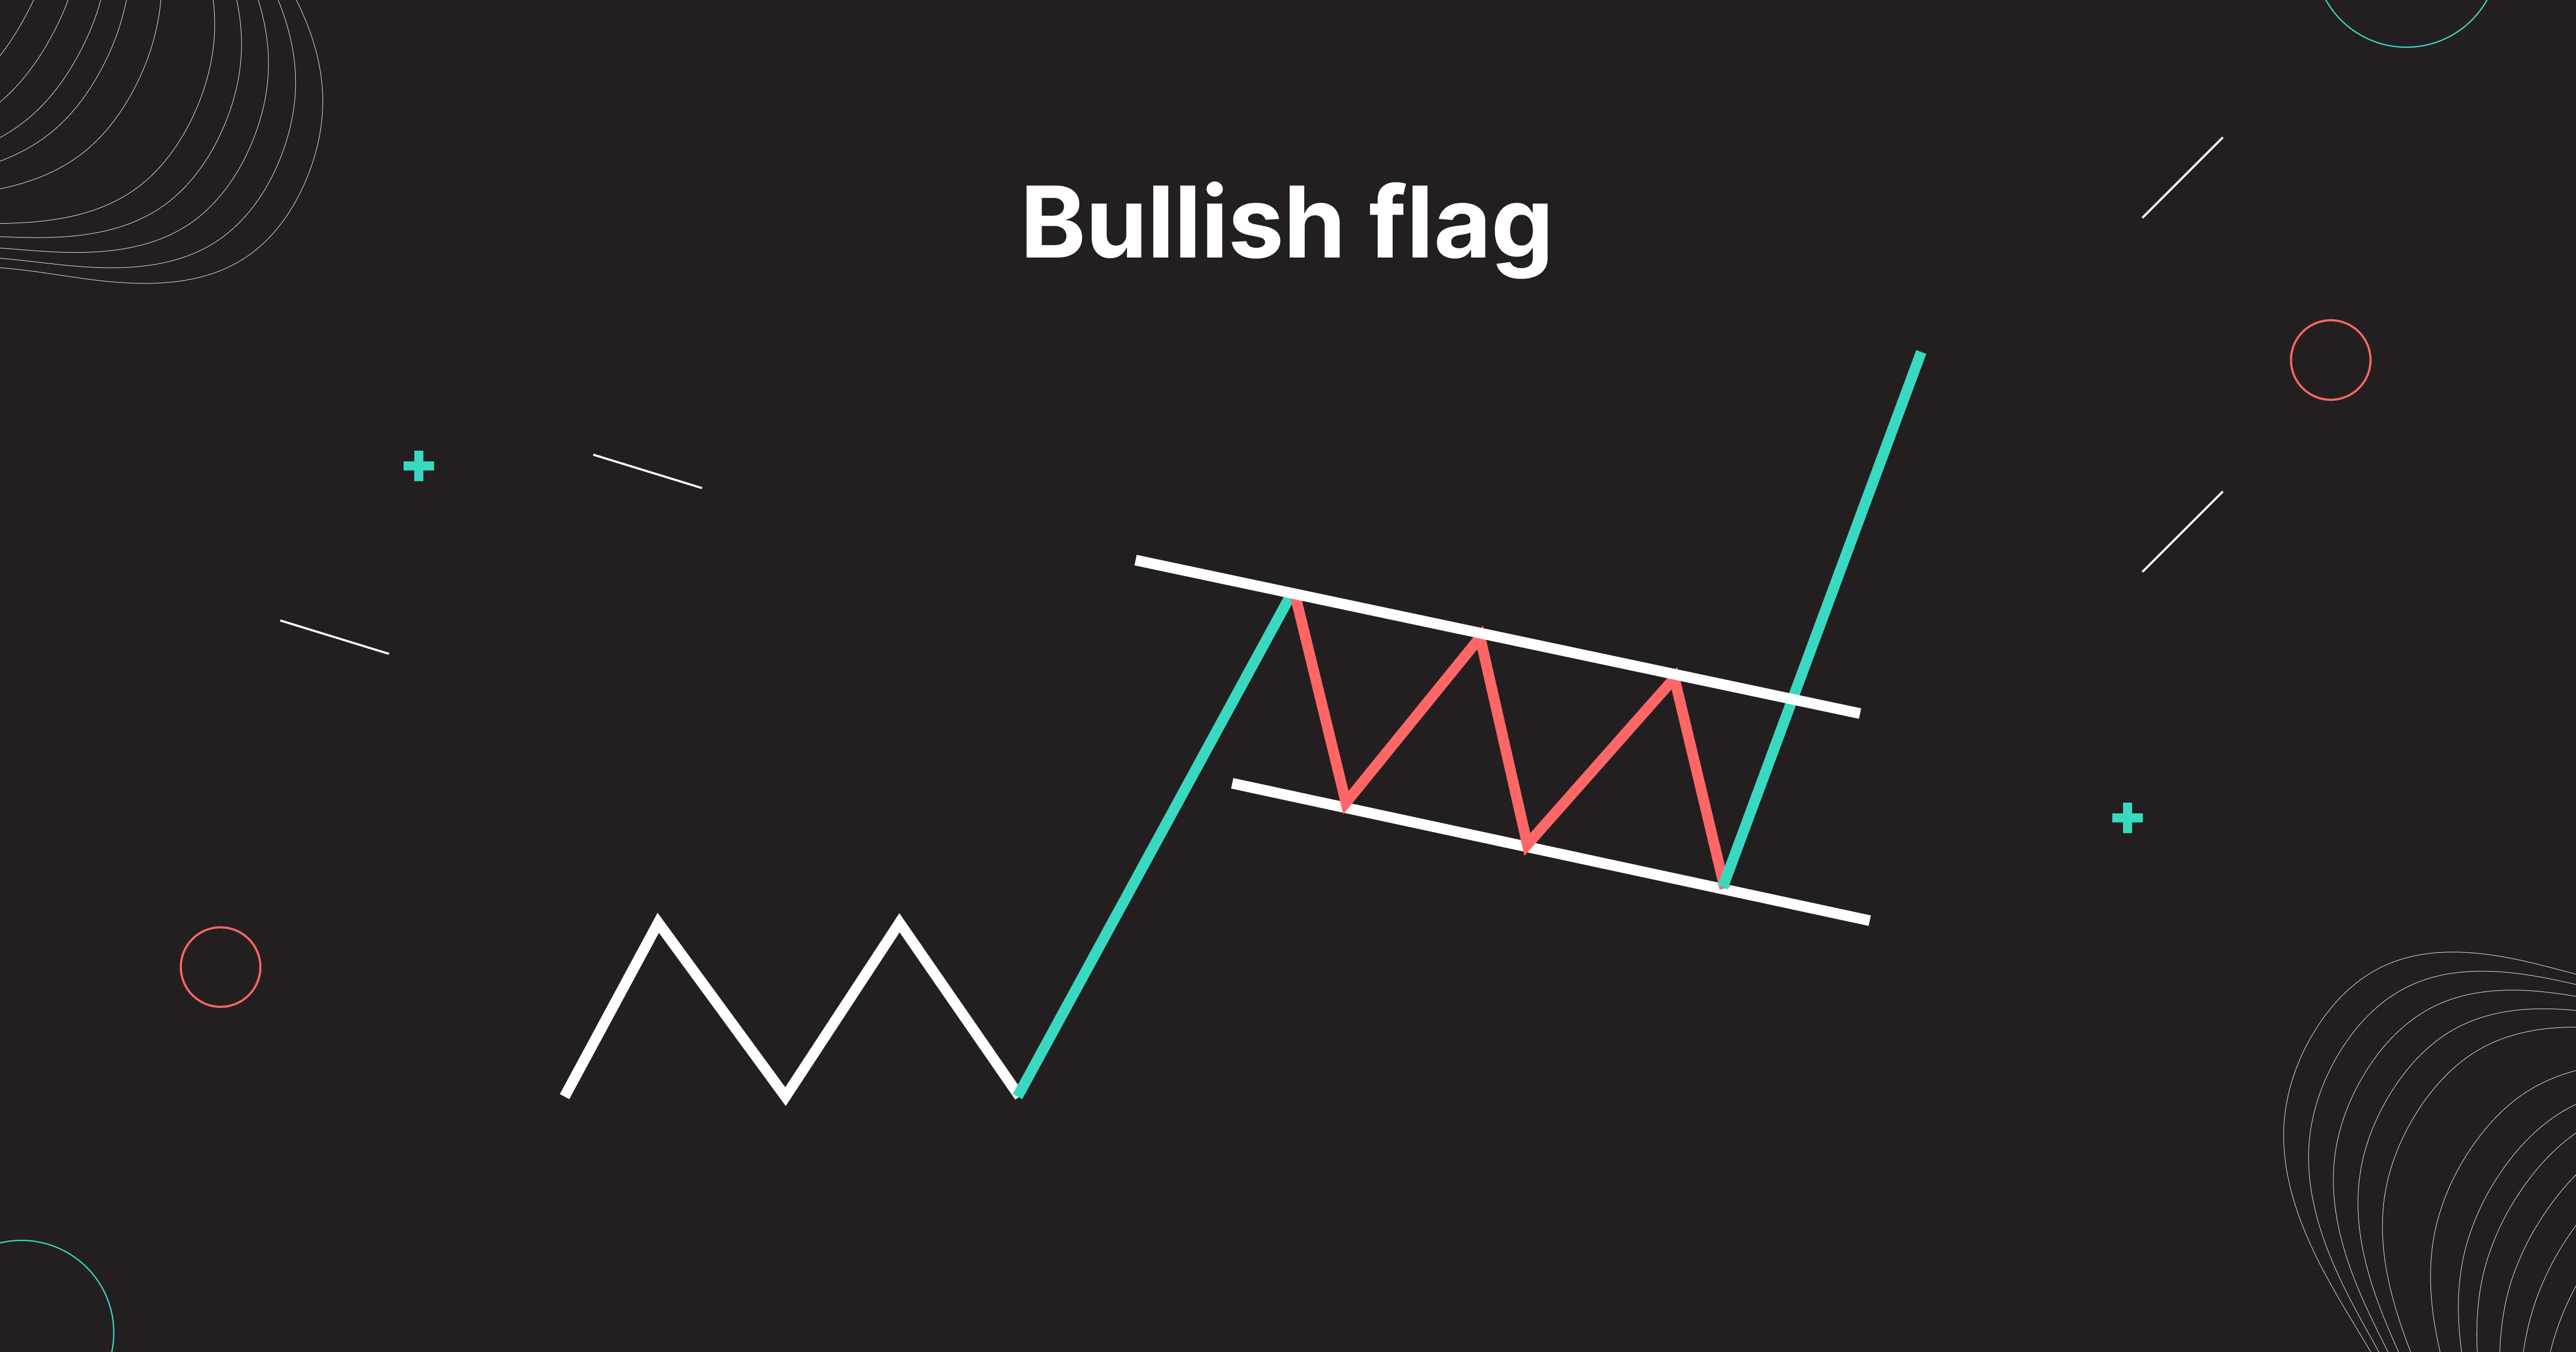
The bull flag pattern is a continuation chart pattern that perfectly works for day trading and occurs immediately after a significant crypto price jump, contributing to the uptrend. The bull flag is one of the most reliable and easy to detect patterns that signal the continuation of a bullish trend, allowing traders to catch the best moment to enter a position and ride the trend till the end. However, before breaking out and continuing the uptrend, the price action consolidates within the two parallel trend lines, following the direction opposite to the rise.
The main goal of this pattern is to assist traders in catching the current market momentum. As a common rule, the bull flag may be considered a strong trading signal if it is formed when the retracement reaches 38.2% from the flagpole high. As a result, you can determine entry levels where the risk is much lower than the potential reward.
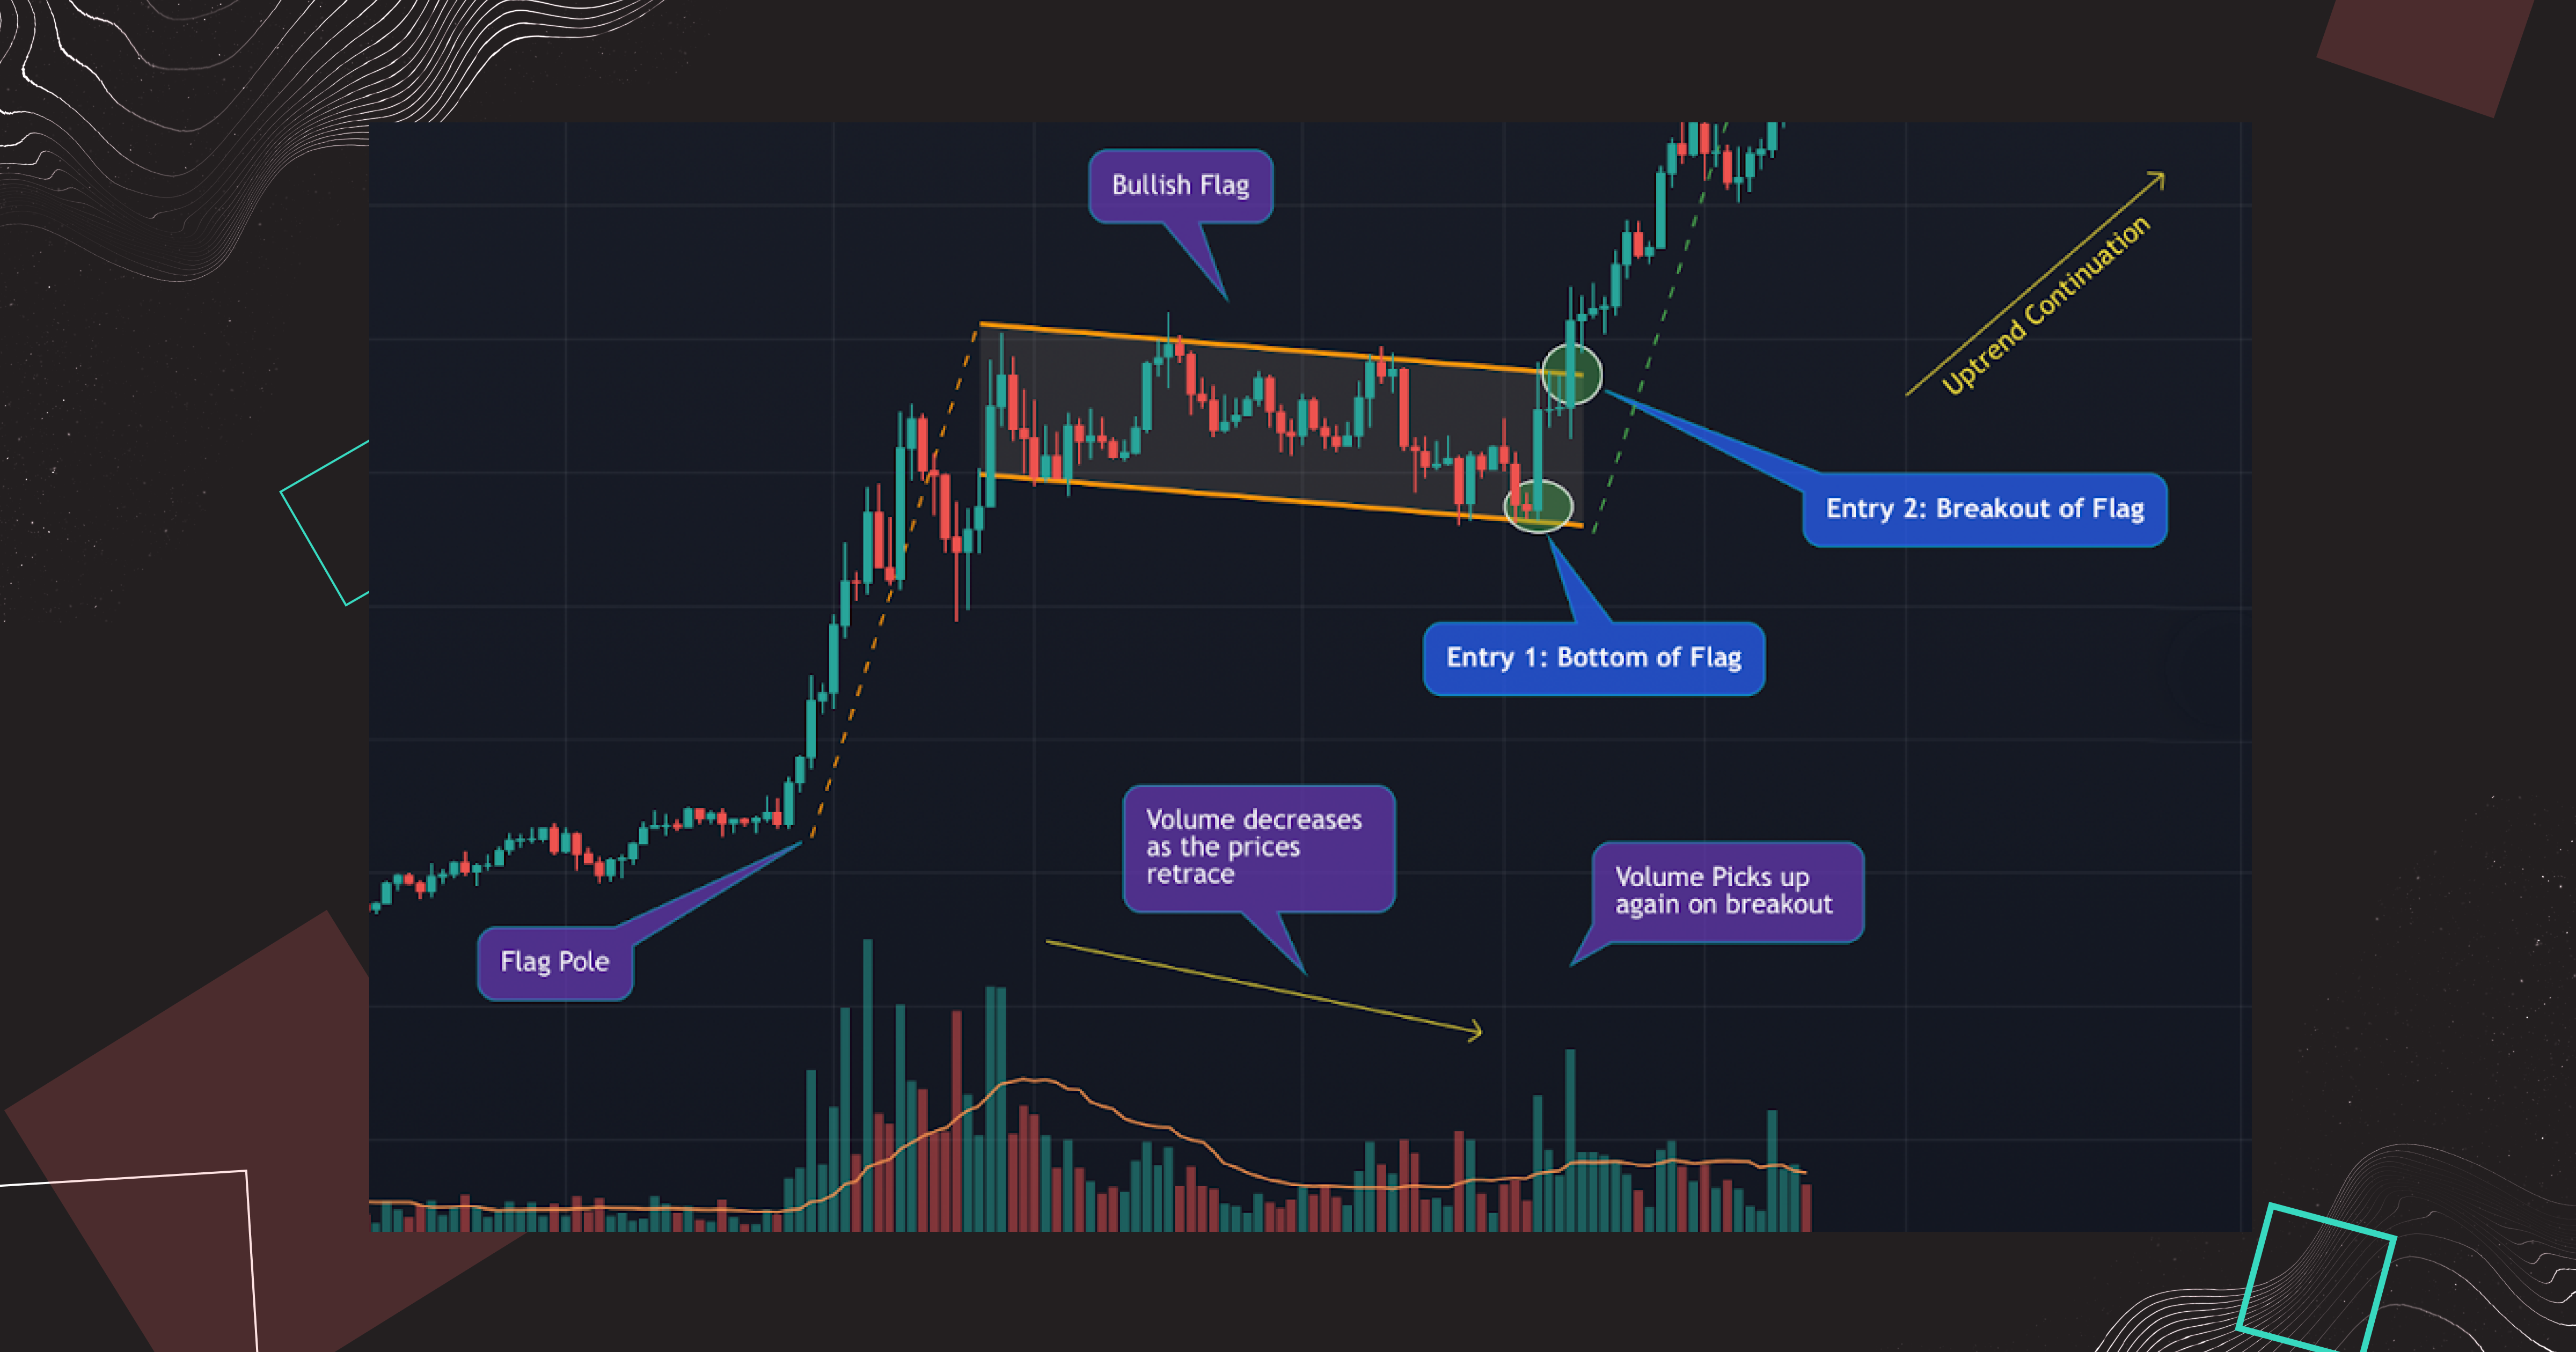
The practice example of a bull flag crypto chart
Visually this pattern features a preceding strong upward movement forming the "pole" followed by a consolidation forming a "flag". And then, an asset's price breakout happens. When it's confirmed, you should open a position. The profit targets at a level located symmetrically to the beginning of the "flag pole".
Double Bottom Pattern
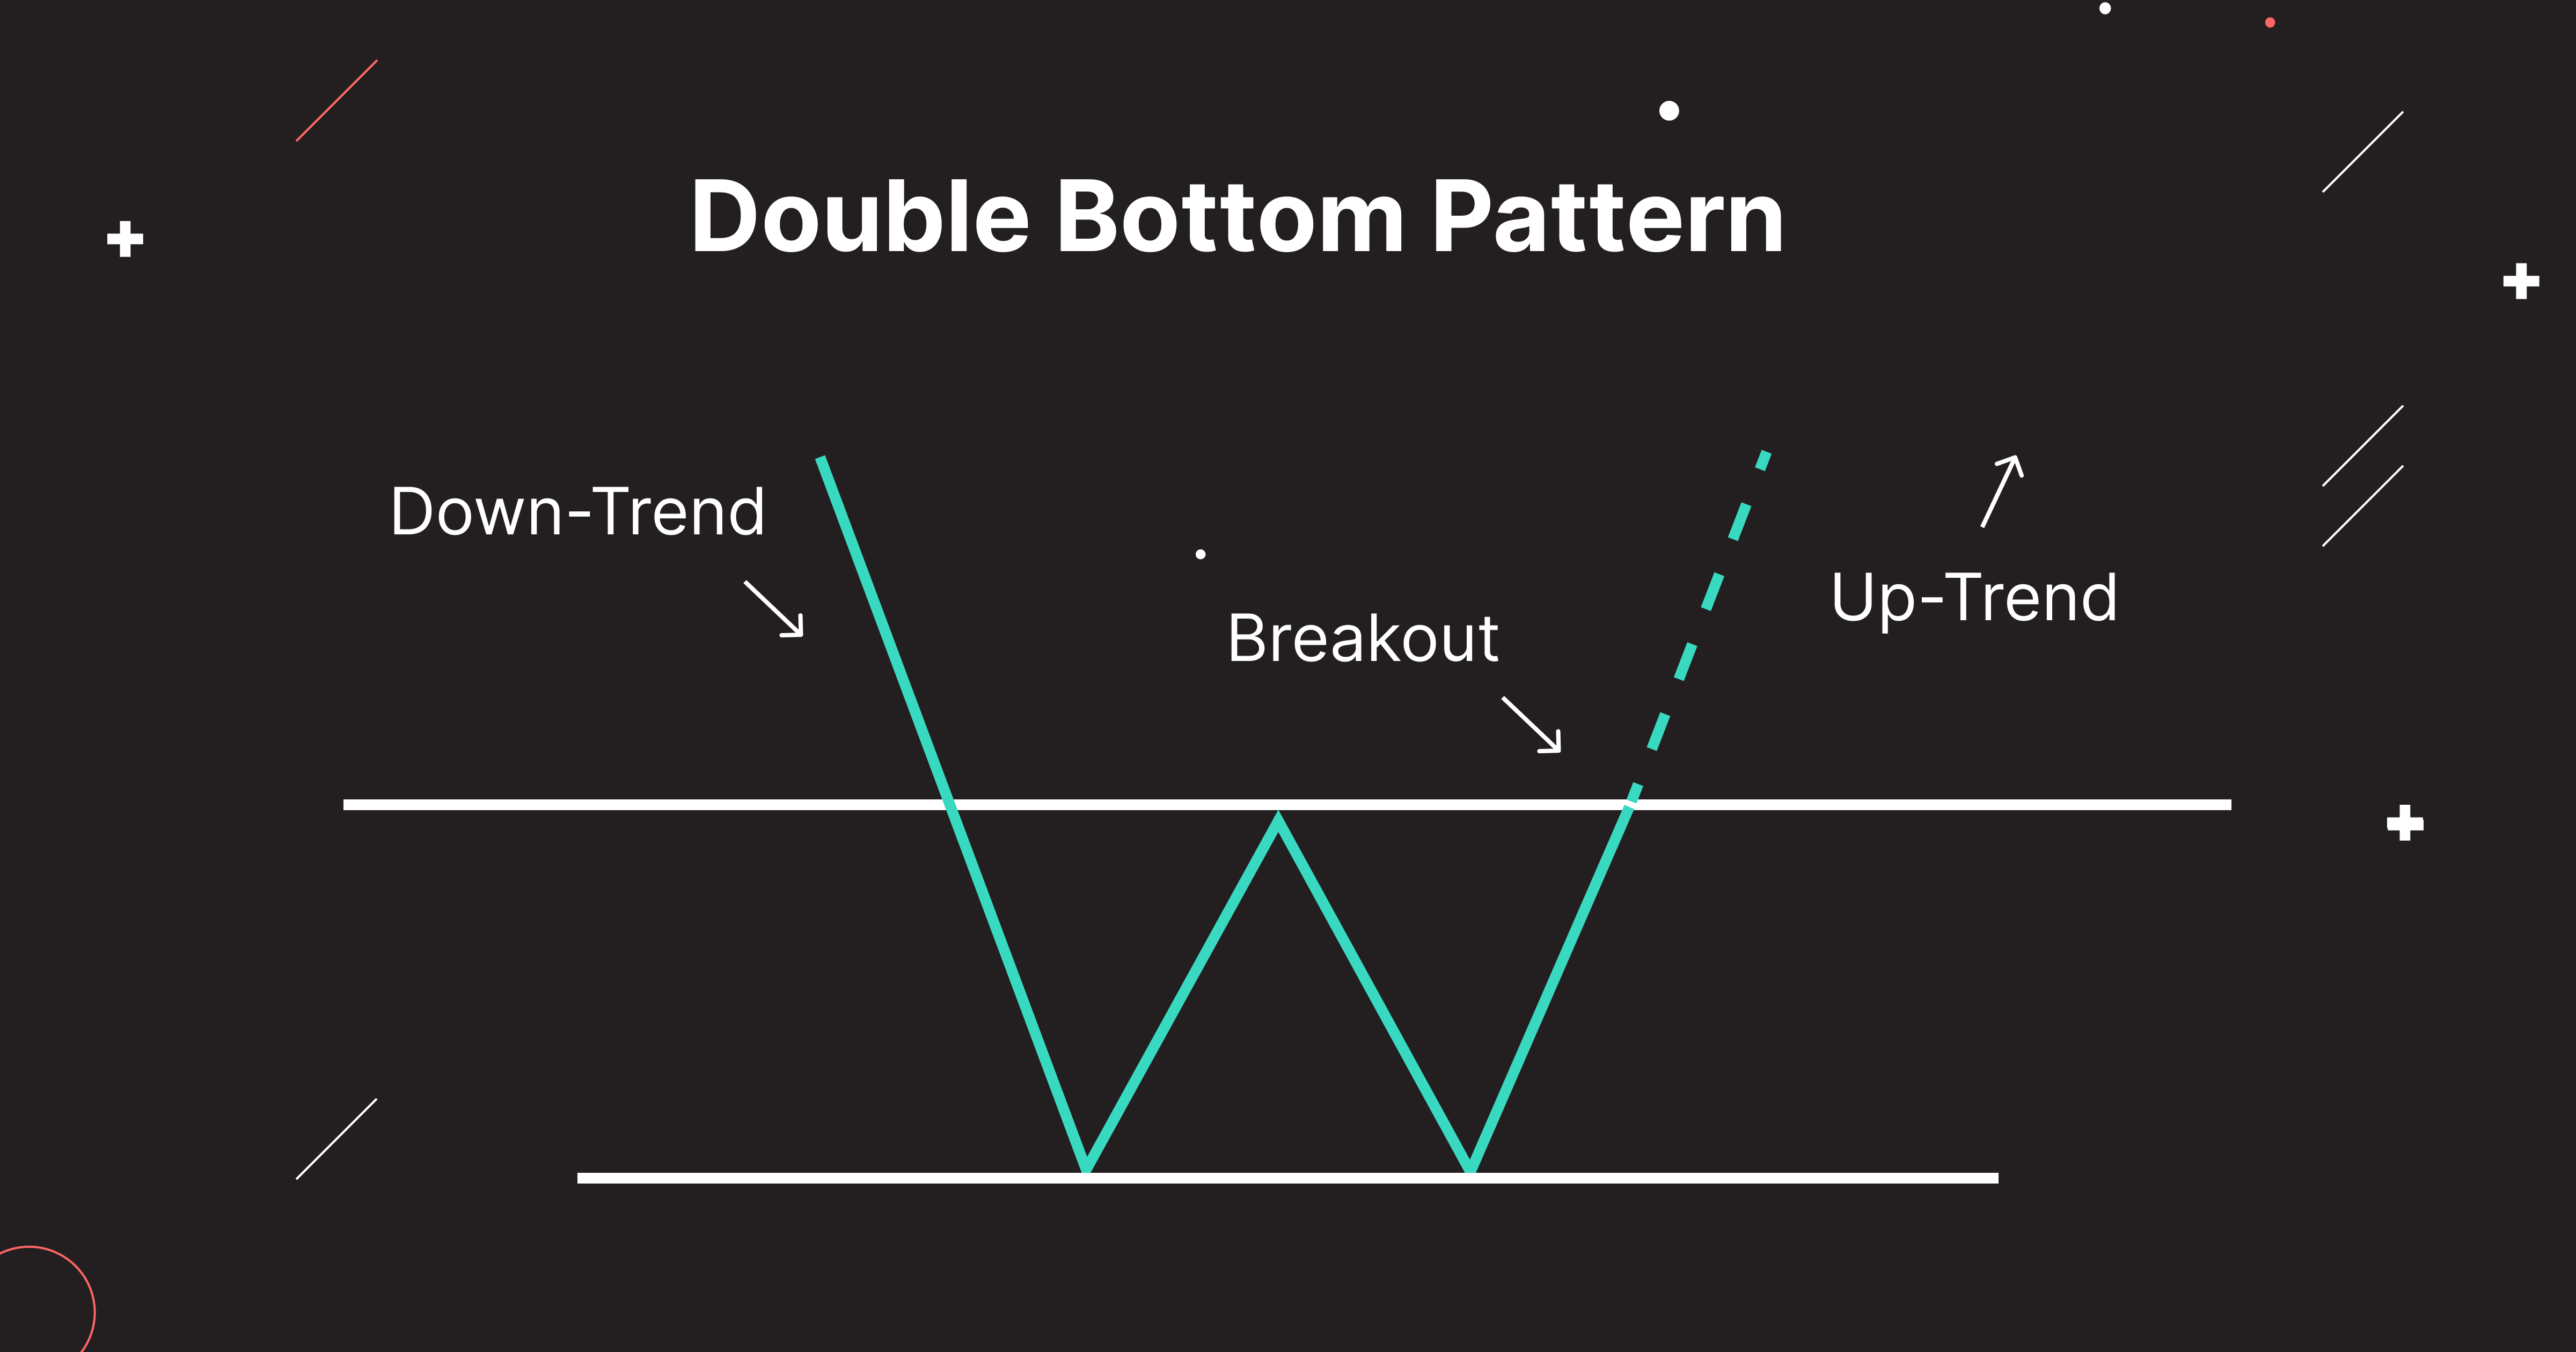
A double bottom pattern occurs when two price bottoms form at relatively the same level, and the price top acts as a resistance. This pattern appears at the end of a downtrend and signals a possible reversal of the bearish trend.
This pattern looks like two successive depressions, approximately equal in depth. They form when the market tests support level twice and then breaks above resistance, resembling the “W” letter.
The main rule of the double bottom bullish pattern is the bigger the gap between the two lows on the chart, the more likely the double bottom chart pattern will work. This fact makes this pattern more suitable for long-term trades as it repeats itself over time.
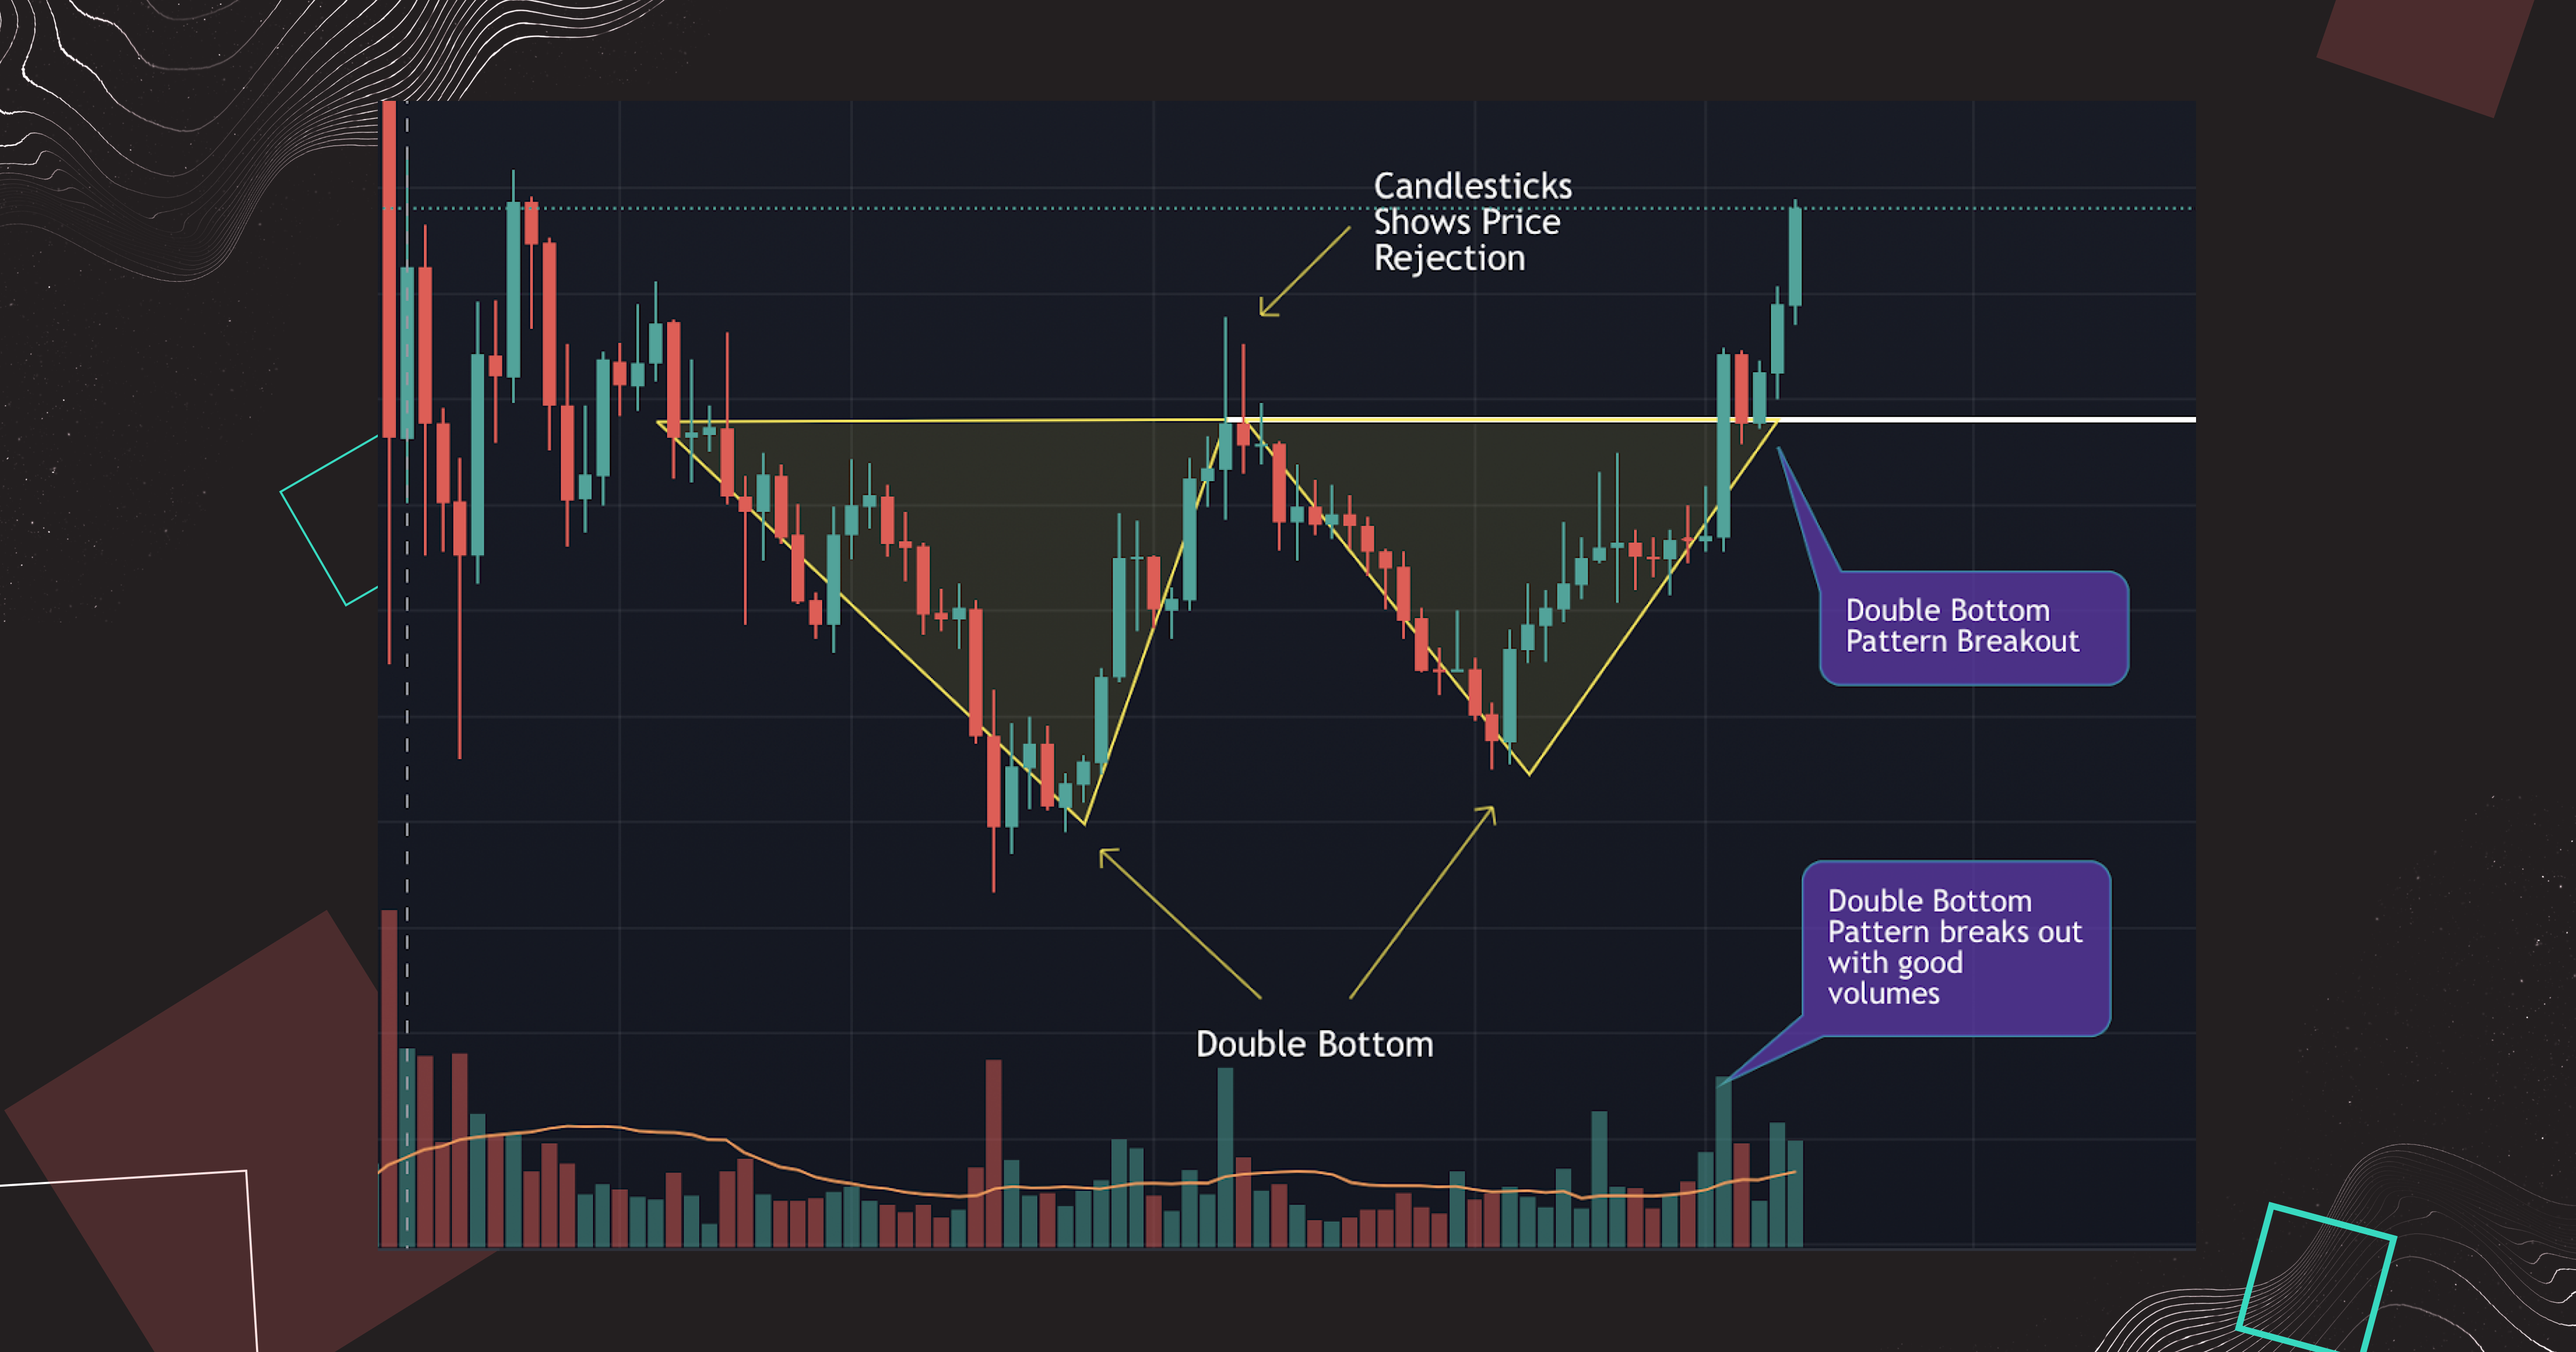
The practice example of a double bottom pattern crypto chart
You can trade a double bottom whenever you spot it on the chart, especially when an existing bearish trend seems oversold. You can use such technical analysis indicators as the Relative Strength Index (RSI) or Stochastic Oscillator (SO) to confirm that. With at least two confirmations, the risk of hitting a stop loss will be lower, and your trading profitable.
Conclusion
Bullish chart patterns help us determine if the trend we see happening will continue or are more likely to change. They help predict future price movements and make winning crypto trades possible. The top five bullish patterns we explained in this article can be perfectly applied in day trading, even by newbies.
However, you must consider that even bullish crypto chart patterns don't make trades profitable 100% of the time. Therefore, when entering a position, you must always consider risk management rules. Besides, it would help ground your trading decision on patterns and the best indicators for day trading to better understand the current cryptocurrency market state and catch profits when trading on bitoftrade.
Essentially, bitoftrade is a decentralized anonymous crypto exchange that makes it possible to trade using advanced trading tools typically available only on centralized exchanges while maintaining ownership of your assets, avoiding the KYC. In addition, users can trade anonymously using a wide range of tools and features such as leverage trading and limit orders for better trading performance.
Trade with chart patterns on bitoftrade to put acquired knowledge about bullish trading patterns into action and make your trading more profitable.
