Intro
In crypto day trading, active traders widely use indicators that follow technical analysis. Unlike fundamental analysis, which focuses on overall economic factors, technical analysis measures only statistical data about price movements and volume to identify trading opportunities.
In short, technical indicators are just a formula added to historic price data to forecast a specific asset's future price. Essentially, indicators can help provide clarity on market conditions and identify trends and areas of value; they assist traders in finding the most favorable entry and exit points and even help them determine places to put stop loss and take profit orders.
Even the most basic technical analysis isn't possible without knowing the indicators and their application. In this article, we will discuss some of the most frequently used technical indicators for day trading and their applications in cryptocurrency.
But, before we dive into every indicator separately, let’s find out where all of them belong for more convenience.
All technical indicators fall broadly into 4 groups:
- Momentum - Stochastic and RSI;
- Volume - On-Balance-Volume (OBV);
- Trend - Moving Averages;
- Volatility - Bollinger bands, Standard deviation, ATR;
Each group, in turn, can be subdivided into leading and lagging indicators.
Now that you've learned the five technical analysis categories and their representatives, let's closely look at the best crypto trading indicators.
Best Leading Indicators for Day Trading
Leading indicators predict market movements based on the previous price data. They tend to anticipate the future direction of a market and provide traders with hints and signals, to make strategic decisions.
However, in practice, leading indicators are not always accurate. Therefore, the traders should not rely exclusively on leading indicators as their prime trigger in trading. Nevertheless, it can be used as a North Star, in some sense, to guide your strategy in the long term.
PRO TIP 💡: Several leading indicators combined with lagging indicators enable traders to see a complete picture more clearly and adjust the strategy accordingly.
Some of the leading indicators we will cover in the following sections are RSI and Stochastic Oscillator.
Stochastic Oscillator
Momentum oscillators are technical tools that signal whether a market is being overbought or oversold. The Stochastic Oscillator is one of the most used momentum oscillators existing today. It compares an asset's most recent closing price to the highest and lowest prices during a specified time frame.
In general, stochastic oscillator charting consists of two lines: one indicates the oscillator's actual value for each session, and the other displays its three-day SMA.
The Stochastic indicator serves as an indication of the asset’s momentum. It ranges from 0 to 100, where the area above 70 is considered an overbought region and the area below 20 indicates an oversold region. When both SMA and Stochastic lines cross the overbought line, this marks a possible entry signal for a short position, and likewise when both lines cross the oversold line.
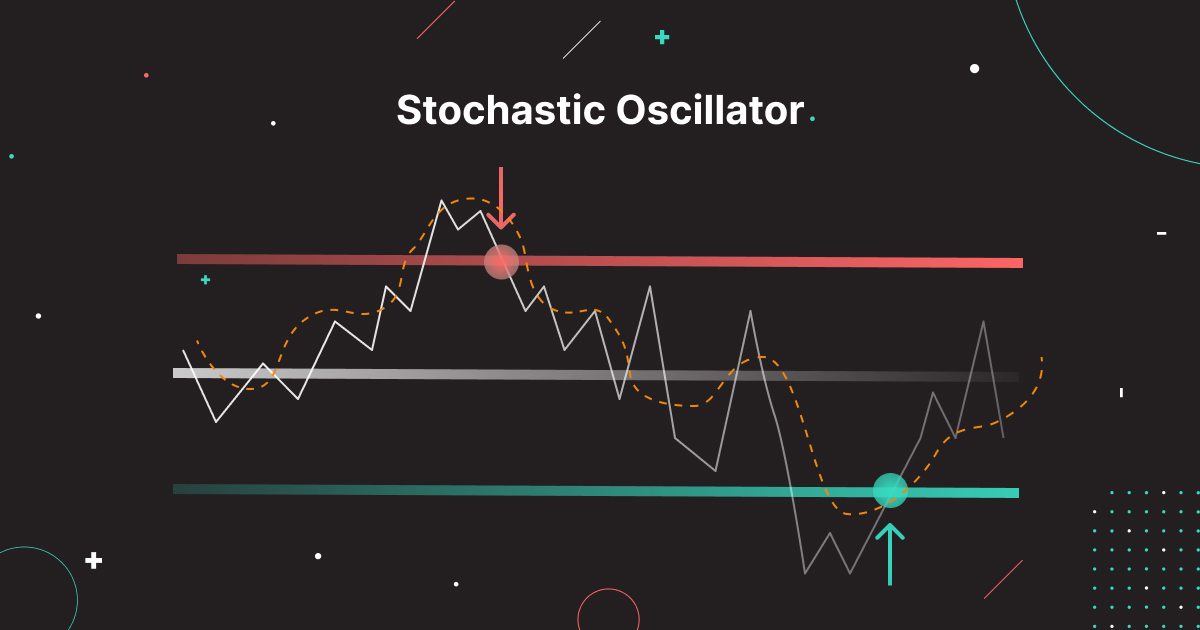
A stochastic oscillator on its own doesn’t provide much information about future price movements - it simply tells if the price of an asset is trending up or down.
Stochastic Divergence occurs when the direction of the indicator trend does not confirm the direction of the price trend. In other words, when there is a deviation in a crypto asset’s movement and Stochastic indication, either overbought or oversold. In this case, divergences help the day traders to determine price reversals both, bullish and bearish. When a divergence occurs, it should alert you to the possibility of a price trend shift. Divergence, however, is not a timing signal. That’s why your trades should not be based on it alone.
RSI Divergence Indicator
The relative strength index (RSI) and the stochastic oscillator are price momentum oscillators commonly utilized in technical analysis.
RSI Divergence acts as both a leading and lagging indicator. It is the lagging indicator at its core because it still requires the price to move first for the indicator to begin moving in that direction.
But the divergence can change the RSI into a leading indicator, showcasing when trends have peaked and are about to reverse. So, although RSI is a lagging indicator, it still can lead the price somehow, such as divergence.
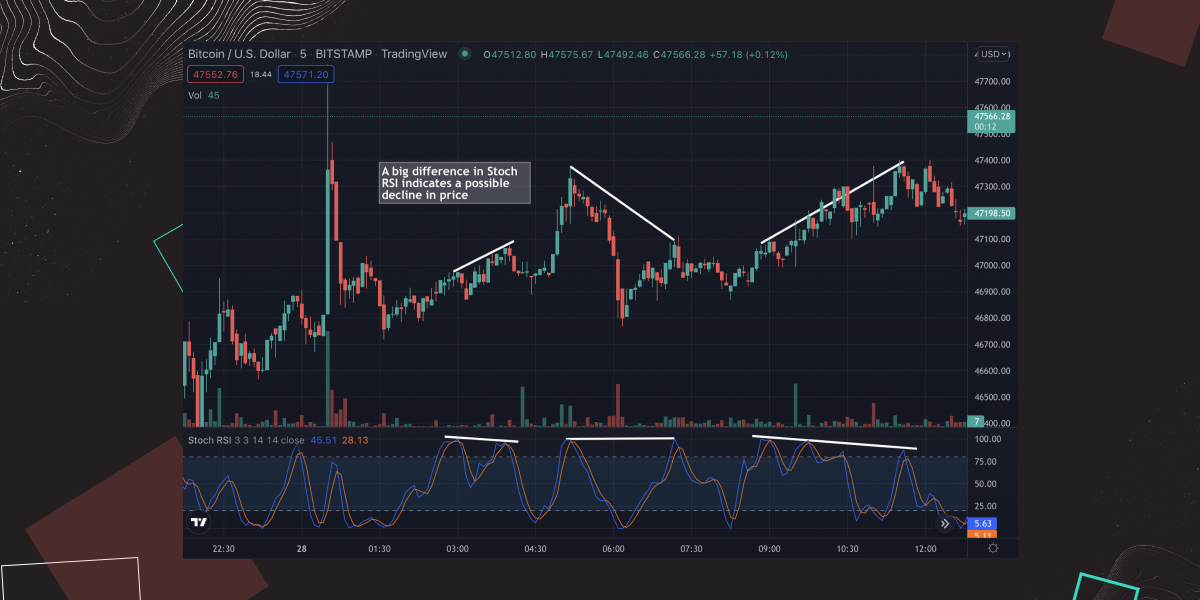 RSI indicator showing divergence on a Tradingview chart.
A Stochastic Oscillator was developed as a more sensitive version of RSI to generate more signals of overbought/oversold conditions. As a result, both the RSI and the Stochastic version of RSI perform better in certain market conditions. For example, RSI is best suited for trending markets since it moves exceptionally quickly between the overbought and oversold areas. While the Stochastic Oscillator, which moves relatively slowly, performs better in flat markets.
The Best Lagging Day Trading Indicators
Lagging indicators follow the price and move only after the price moves. They tell about what has already happened and confirm patterns that are in progress.
Even though lagging indicators provide traders with delayed feedback, they can still help demonstrate simplified price fluctuations. Therefore, lagging indicators are considered the best indicators for long-term trading strategies. They confirm recent price actions and give insights into where the market heads in the future. Day traders who are willing to make a profit in a short time frame can also leverage lagging indicators in their cryptocurrency strategy. When lagging indicators on short-term timeframes combine with leading indicators, they provide additional hints for additional clarity to your technical analysis and reduce the possibility of false trading signals.
The most common lagging indicators include moving averages, stochastic oscillators, and the RSI.
SMA Indicator
Moving averages are exactly what they sound like - it is the average movement of price over a certain period of time. Moving Averages are mainly divided into 2 types: Simple Moving Averages (SMA) and Exponential Moving Averages (EMA).
In this section, we will solely focus on the SMA trading indicator as it’s the most popular one.
Simple Moving Average, or SMA line, “summarizes” the previous market price action and showcases it as a smooth line on the chart. It helps assess the assets' trend by averaging the daily price over a fixed time period.
The SMA indicator provides aspiring traders with opportunities to make a profit on future trends. For example, if the price of a crypto asset is consistently trading above the SMA line, that could signify a bullish pattern. As a result, the moving average rises to reflect the rising price, allowing traders to enter a buy position earlier.
What’s more, the SMA line can work to identify both support and resistance levels. The 50-day moving average and the 100 and 200-day moving averages are crucial levels of support or resistance used by traders.
PRO TIP 💡: the longer the period analyzed by SMA (i.e., 100 or 200 days), the more accurate and strong its signals are. However, they will indicate the long-term trend of a crypto asset’s price. If you day trade, you should ground your decisions for shorter period SMAs (50 days or less) for catching and riding the local (day or hour) trend.
The chart below is an example of SMA being used as support and resistance levels.
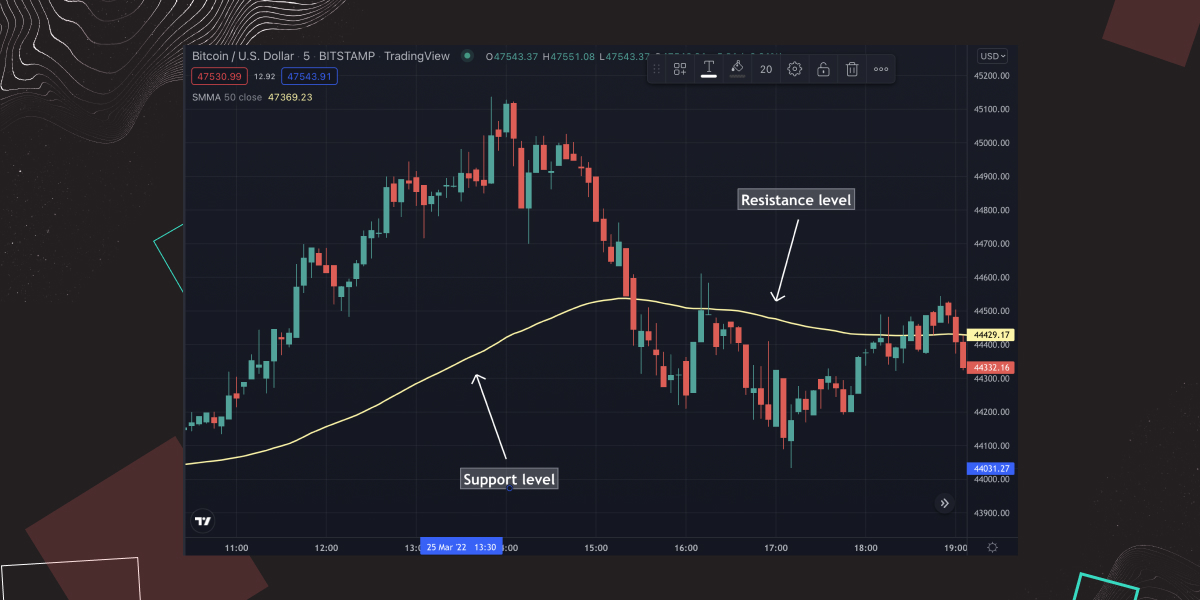 Simple Moving Average smooths out volatility and arguably brings the most value when making long-term decisions.
Boll Indicator aka Bollinger Bands
Invented by John Bollinger in the 1980s, the Boll indicator, or Bollinger Bands, is a widely used technical indicator that provides unique insights on price and volatility.
Bollinger Bands are composed of 3 lines - a 20-day simple moving average (SMA) for the middle band and two plotted bands at a standard deviation level above and below. Both upper and lower bands are used in conjunction with a moving average to determine whether prices on a market are high or low.
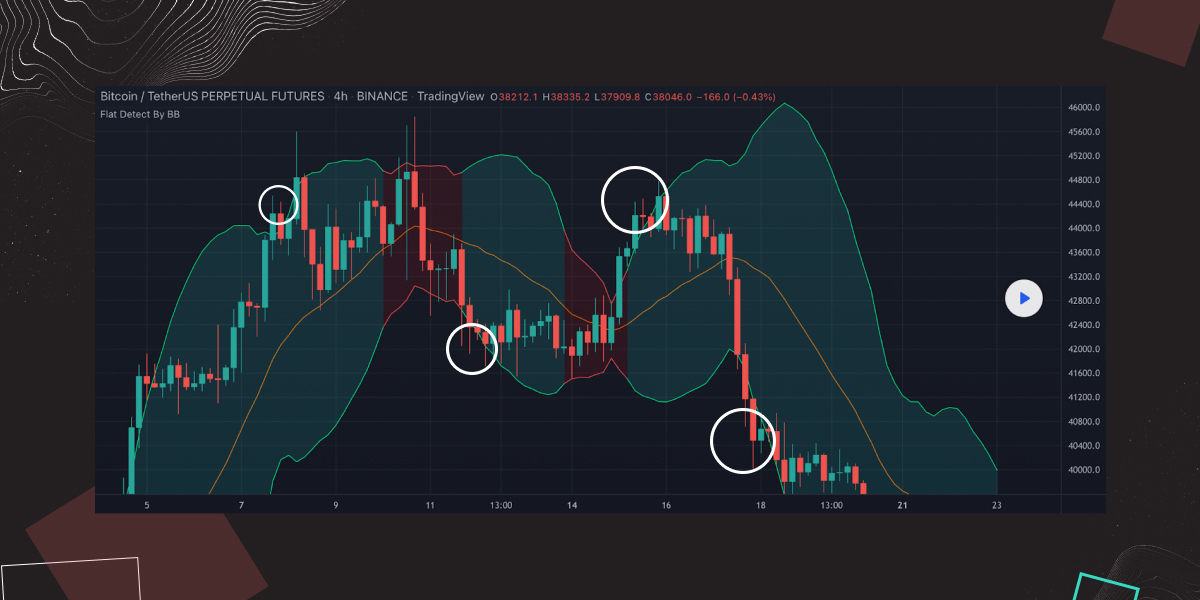
John Bollinger developed a set of 22 rules to follow on how to use Bollinger Bands in the trading strategy. One of them was about using Bollinger Bands to identify whether the market is being overbought/oversold.
When the price moves above the upper band, the prices are thought to be overbought identifying a strong possibility to Sell. Conversely, a move below a lower band suggests that the prices are oversold, triggering a Buy signal. Such breakouts are an extremely rare event, as nearly 90% of all price movements occur within the two bands.
 Another highly popular Bollinger Bands strategy is a squeeze strategy. The squeeze occurs in a period of low volatility when the price of an asset consolidates, resulting in tight upper and lower bands. This event informs traders about the likelihood of drastic price action in either direction.
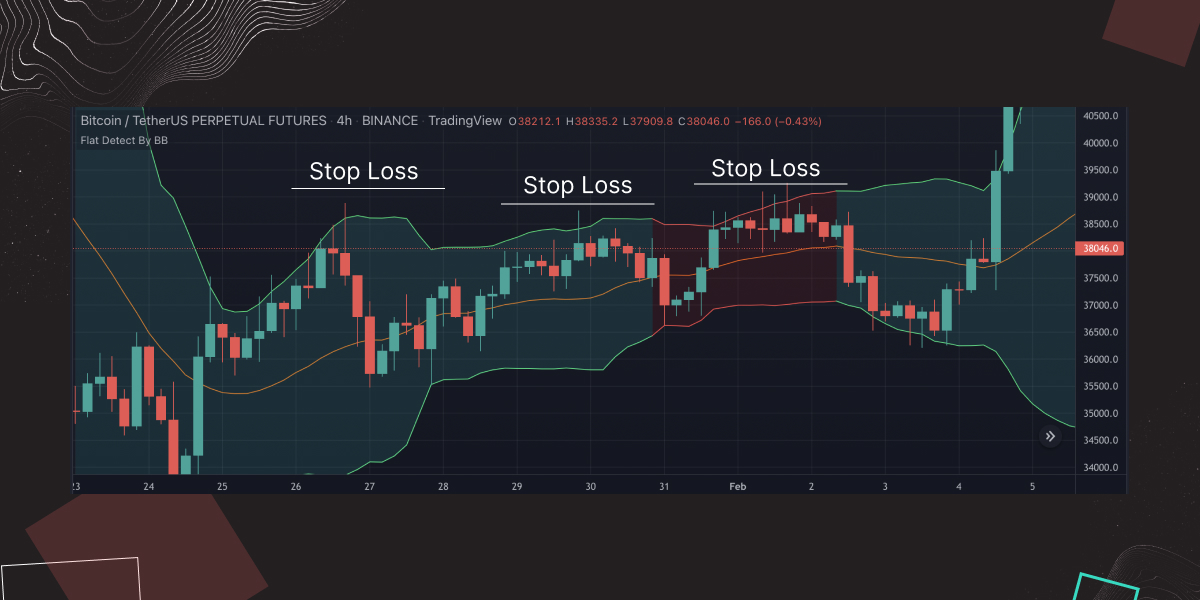
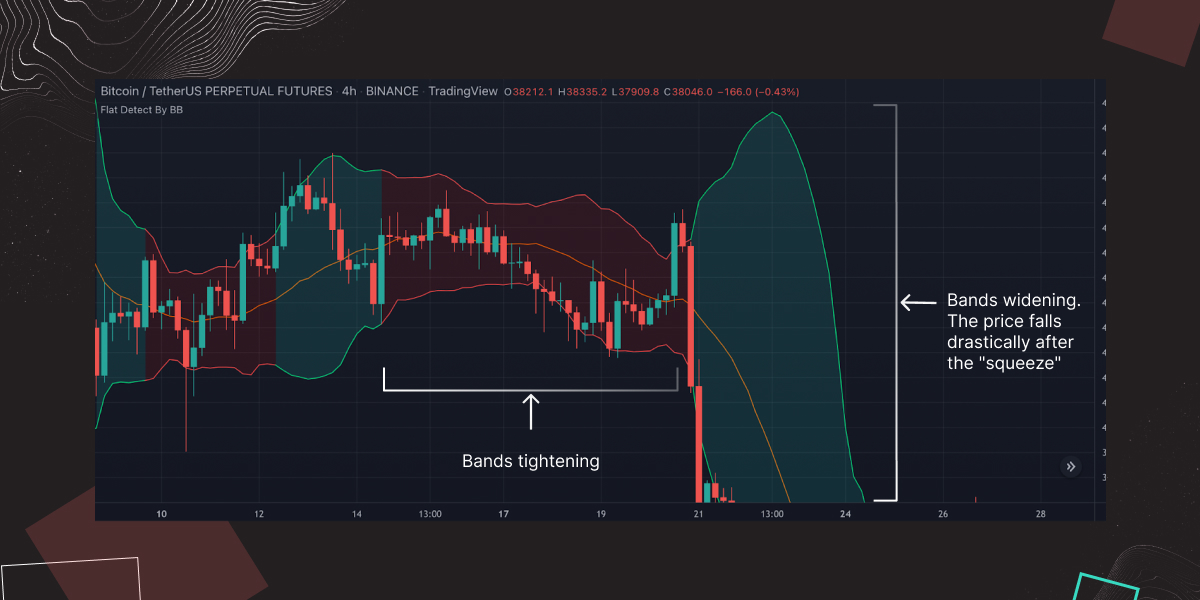 When the asset price breaks through one of the 2 bands, it triggers a trader to buy or sell it. However, conversely to the highly volatile market explained at the beginning of this section, traders should expect a crypto asset price increase if three price candles close above the upper band after the Bollinger Bands squeeze. And vice versa for opening a short position. Generally, outside the consolidation, a stop-loss order should be placed on the other side of the breakout.
Average True Range Indicator
What is ATR indicator? So, Indicator Average True Range, at its core, measures volatility in the market. It was created by the same gentlemen that created RSI - J. Welles Wilder.
If you wonder about how to use ATR indicator, first things first, you have to embrace how it is calculated. ATR indicator depends entirely on price fluctuations and the range of a candle - as the range of the candles gets smaller, ATR values will decrease, the same rule applies when the range of the candles increases.
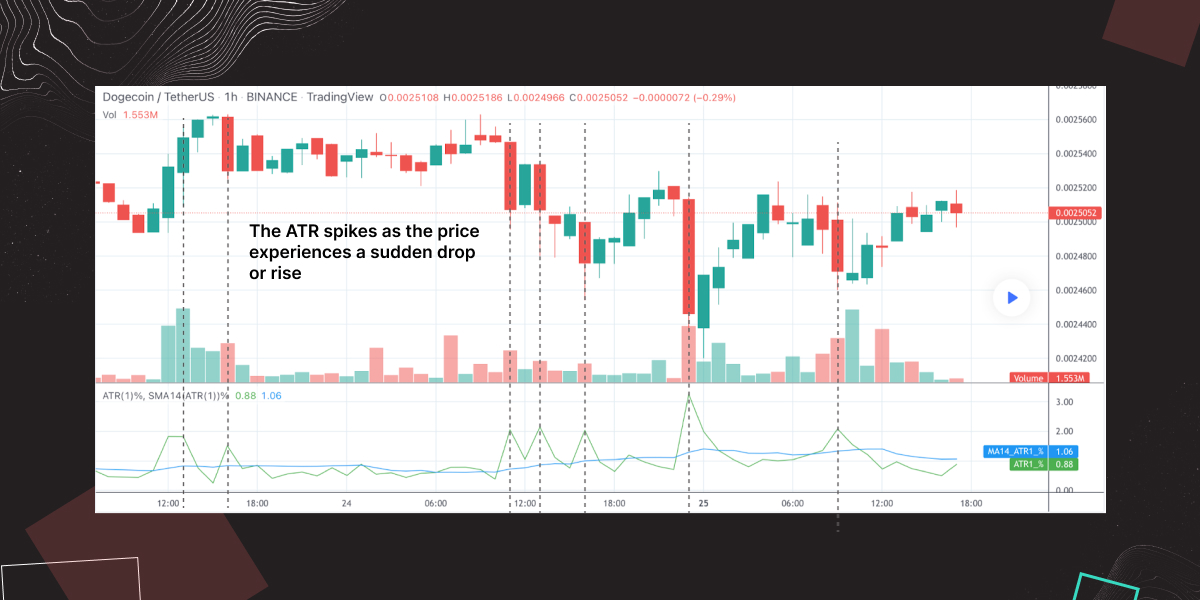
ATR trading indicator helps us stay in line with the volatility of a particular cryptocurrency pair or a specific time frame to keep from getting kicked out of the market. Knowing the ATR value, the trader can place a stop limit and take profit orders more efficiently to give you an idea. If the market volatility is low, traders can take advantage of placing tighter stop orders and utilize wider stops in a highly volatile environment.
Wrapping up
Your ability to use technical analysis to make good trading decisions and inevitably make money in any market is imperative and is something you can not disregard.
“The more, the better” principle does not work in technical analysis since the indicators are meant to simplify your trading, not the other way around. Every technical indicator can complement your strategy in many ways only if utilized correctly.
In most scenarios, the ideal way would be to start with the most popular indicators, altering one at a time, and evaluating if the result improves or degrades your performance. However, you shouldn’t be relying on 1 specific indicator as a standalone source of insights and hints - it is wise to combine a few leading and lagging indicators to avoid false signals and patterns.
In the end, the most essential element of your strategy is choosing the right exchange to put the knowledge you gained in this article into practice. All of the patterns described above can be found on TradingView - a place where you can discover the usage of various indicators and try out replicating the cases on bitoftrade yourself. Our platform enables traders to leverage a bunch of unique but highly demanded tools to conduct a proper technical analysis of the market.
bitoftrade is a novice way to trade cryptocurrency in a permissionless manner. The DEX doesn't require a trader to pass the KYC process. bitoftrade offers a wide range of trading tools, including leverage trading, stop limit and take profit orders (coming soon), and a variety of technical indicators (coming soon) that back in the day were available only for the users of centralized exchanges. So no matter whether you are a rookie trader or an advanced market player, everyone can grasp the benefits of trading on the anonymous cryptocurrency exchange and improve their odds to profit.
Ready to jumpstart cryptocurrency efficiently? There is no simpler answer than bitoftrade!
Connect your wallet and Start Trading NOW!